Edit chart
Loading graph
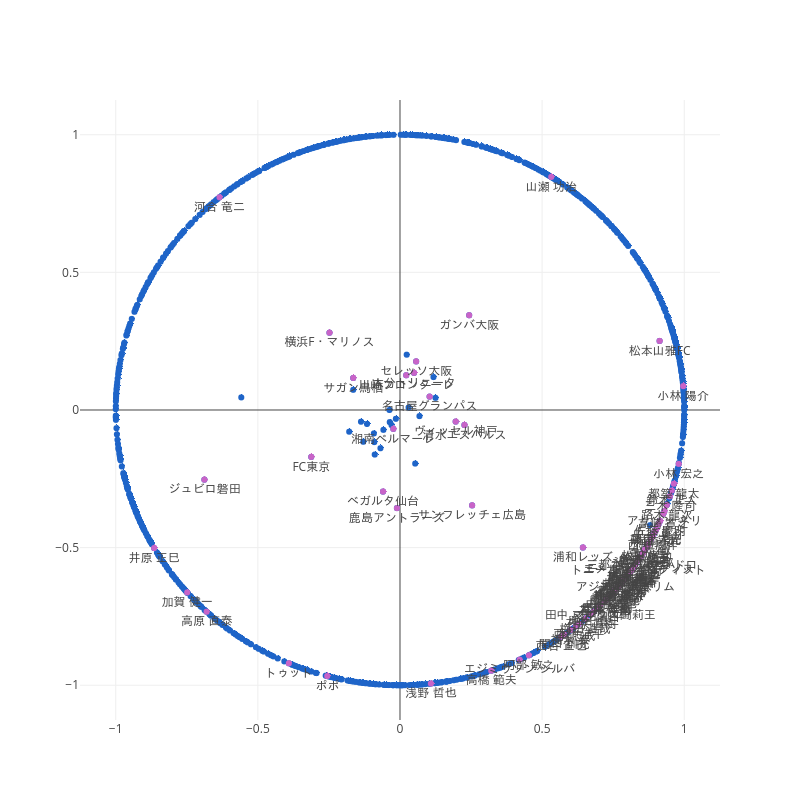
Upura's interactive graph and data is a line chart. The x-axis shows values from -1.1256967764813182 to 1.1257448209687584. The y-axis shows values from -1.126231343080563 to 1.126156575594612.