Edit chart
Loading graph
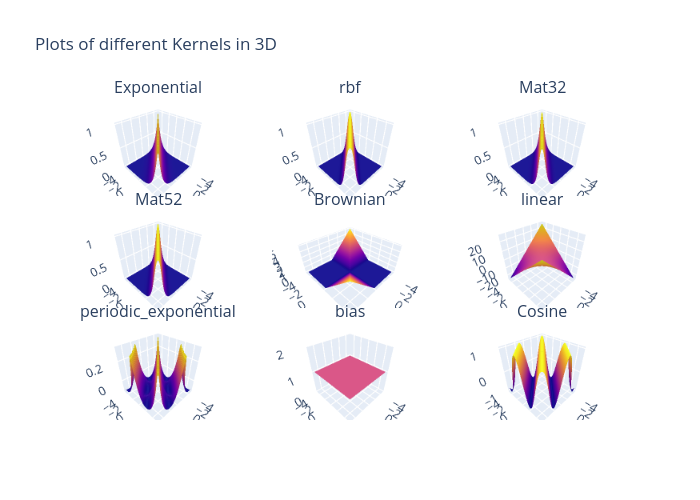
Usc_eric_vader's interactive graph and data of "Plots of different Kernels in 3D" is a surface. The x-axis shows values from 0 to 0. The y-axis shows values from 0 to 0. This visualization has the following annotations: Exponential; rbf; Mat32; Mat52; Brownian; linear; periodic_exponential; bias; Cosine