Edit chart
Loading graph
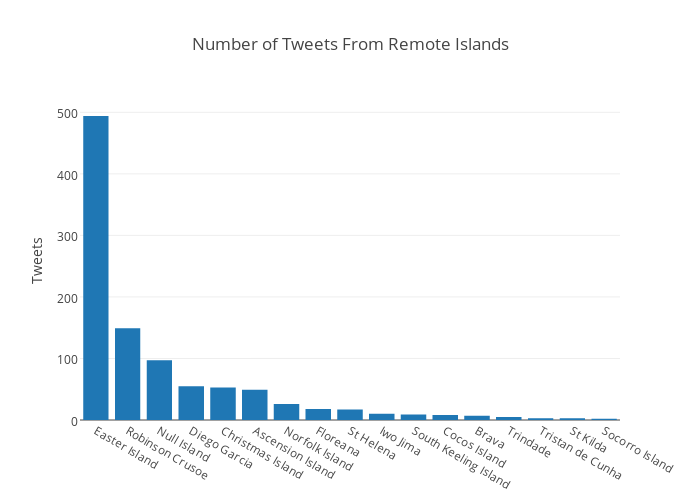
Vanhoesenj's interactive graph and data of "Number of Tweets From Remote Islands" is a bar chart, showing Tweets; with Tweets in the y-axis. The x-axis shows values from -0.5 to 16.5. The y-axis shows values from 0 to 520.