Edit chart
Loading graph
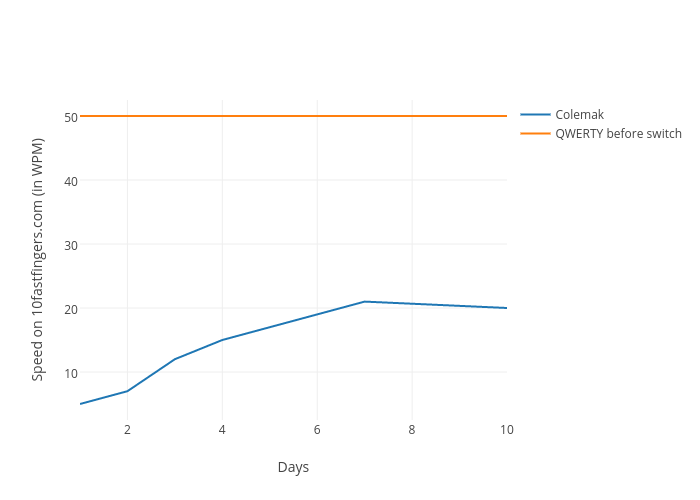
Varunpriolkar's interactive graph and data of "Speed on 10fastfingers.com (in WPM) vs Days" is a line chart, showing Colemak vs QWERTY before switch; with Days in the x-axis and Speed on 10fastfingers.com (in WPM) in the y-axis.. The x-axis shows values from 1 to 7. The y-axis shows values from 2.4999999999999996 to 52.5.