Edit chart
Loading graph
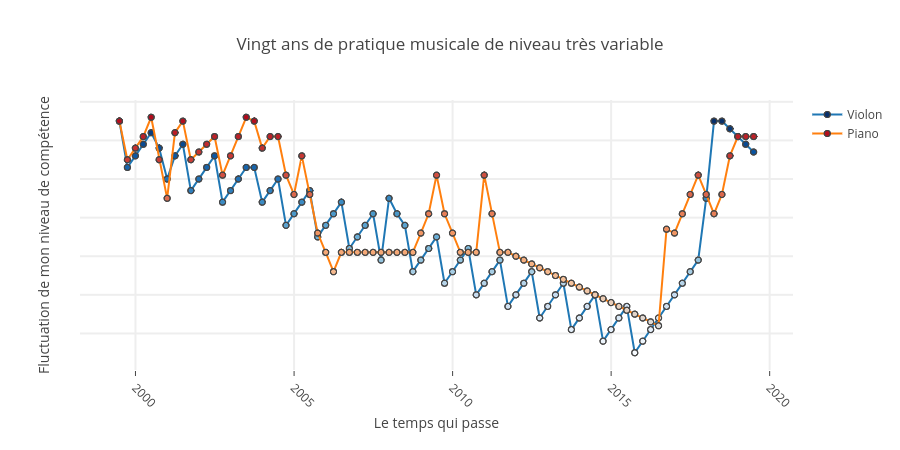
Veroderberg's interactive graph and data of "Vingt ans de pratique musicale de niveau très variable" is a line chart, showing Violon vs Piano; with Le temps qui passe in the x-axis and Fluctuation de mon niveau de compétence in the y-axis.. The x-axis shows values from 1998-04-02 04:09:18.562 to 2020-09-25 19:50:41.438. The y-axis shows values from 30.531847133757964 to 100.46815286624204.