Edit chart
Loading graph
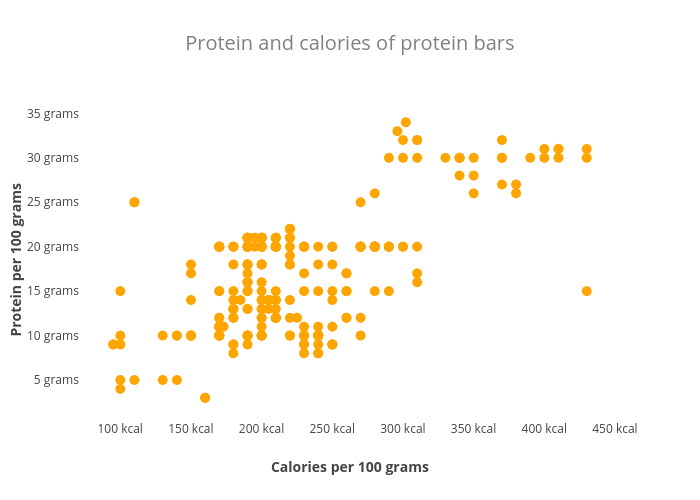
Vikfand's interactive graph and data of "Protein and calories of protein bars" is a scatter chart, showing tiss; with Calories per 100 grams in the x-axis and Protein per 100 grams in the y-axis.. The x-axis shows values from 74.60142143680369 to 450.39857856319634. The y-axis shows values from 0.8857220906938621 to 36.11427790930614.