Edit chart
Loading graph
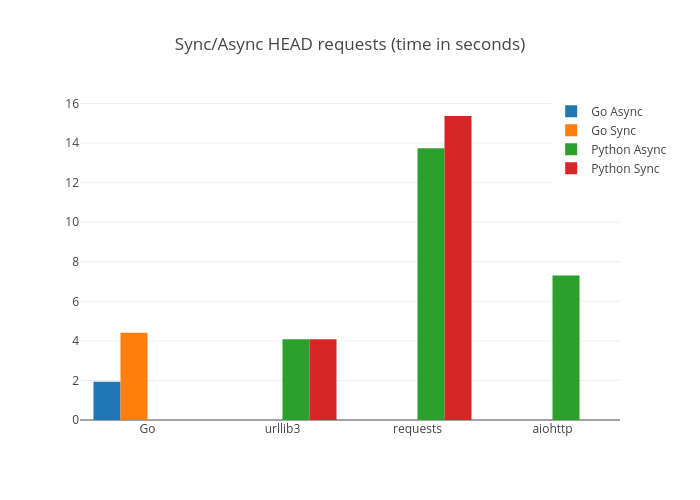
Vipul's interactive graph and data of "Sync/Async HEAD requests (time in seconds)" is a bar chart, showing Go Async, Go Sync, Python Async, Python Sync. The x-axis shows values from -0.5 to 3.5. The y-axis shows values from 0 to 16.178947368421053.