Edit chart
Loading graph
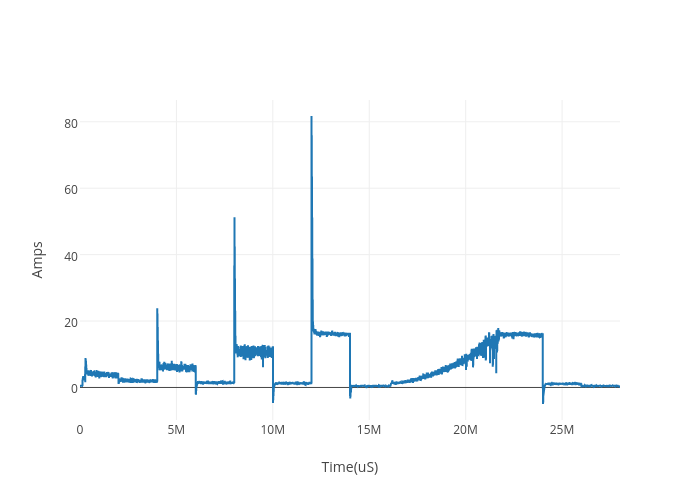
Virtualender's interactive graph and data of "Amps vs Time(uS)" is a scatter chart, showing Amps; with Time(uS) in the x-axis and Amps in the y-axis.. The x-axis shows values from 4 to 28003591. The y-axis shows values from -9.797222222222222 to 86.54722222222223.