Edit chart
Loading graph
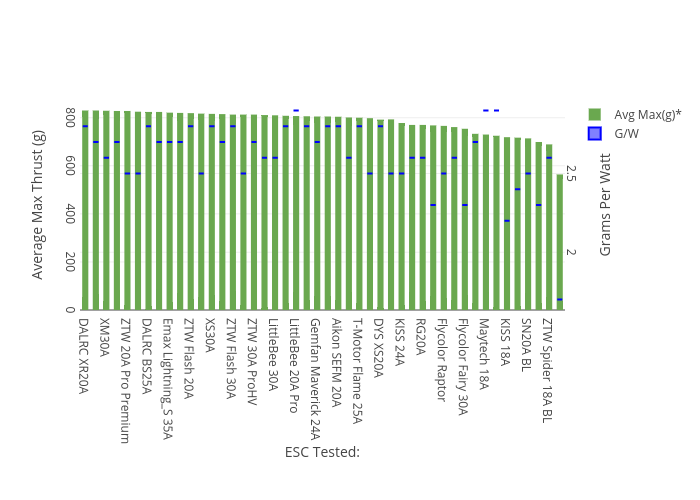
Virtualender's interactive graph and data of "Average Max Thrust (g) vs ESC Tested:" is a grouped bar chart, showing Avg Max(g)* vs G/W; with ESC Tested: in the x-axis and Average Max Thrust (g) in the y-axis.. The x-axis shows values from -0.5 to 45.5. The y-axis shows values from 0 to 873.6842105263158.