Edit chart
Loading graph
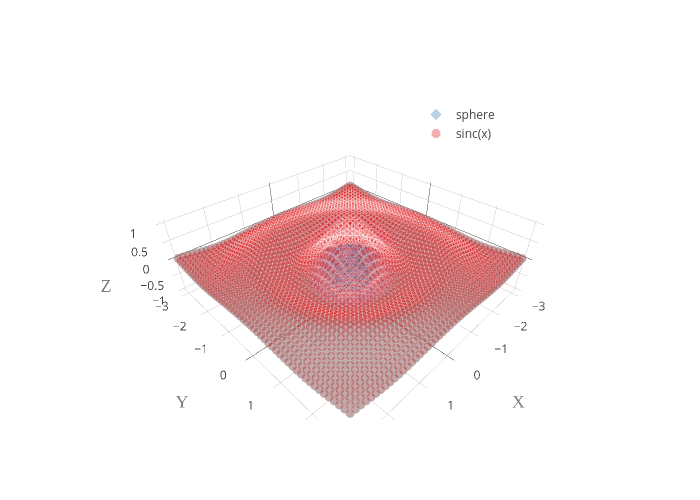
Vlas-sokolov's interactive graph and data of "sphere vs sinc(x)" is a scatter3d, showing sphere vs sinc(x). The x-axis shows values from 0 to 0. The y-axis shows values from 0 to 0.