Edit chart
Loading graph
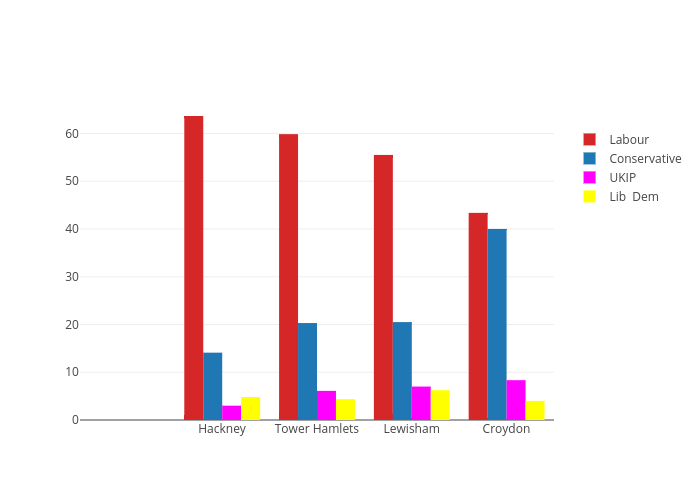
W.fediow's interactive graph and data of "Labour, Conservative, UKIP, Lib Dem" is a bar chart, showing Labour, Conservative, UKIP, Lib Dem. The x-axis shows values from 0.5 to 4.5. The y-axis shows values from 0 to 67.