Edit chart
Loading graph
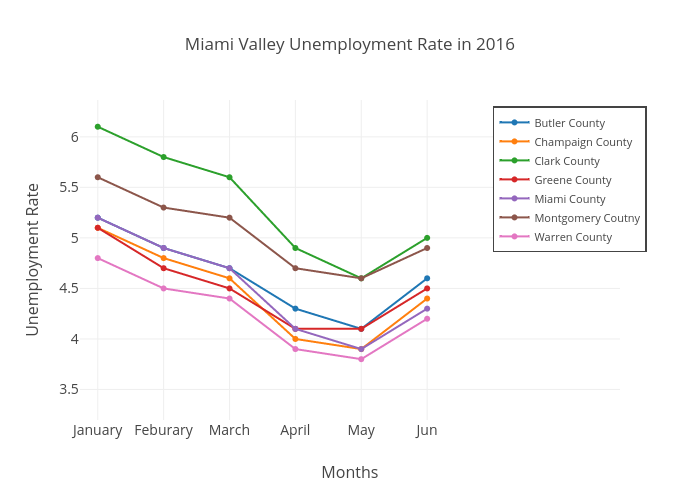
W201mxl's interactive graph and data of "Miami Valley Unemployment Rate in 2016" is a scatter chart, showing Butler County, Champaign County, Clark County, Greene County, Miami County, Montgomery Coutny, Warren County; with Months in the x-axis and Unemployment Rate in the y-axis.. The x-axis shows values from 0.7305879649196836 to 8.927226670622165. The y-axis shows values from 3.198164780936083 to 6.364323059695323.