Edit chart
Loading graph
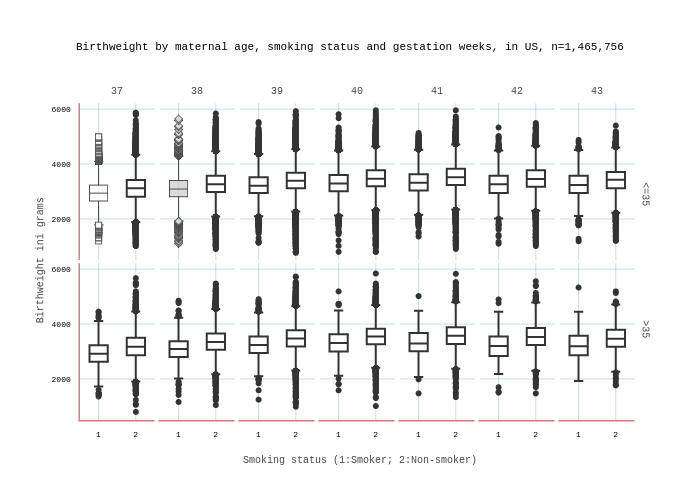
Watzilei's interactive graph and data of "Birthweight by maternal age, smoking status and gestation weeks, in US, n=1,465,756" is a box plot, showing 1, 1, 1, 1, 1, 1, 1, 1, 1, 1, 1, 1, 1, 1, 2, 2, 2, 2, 2, 2, 2, 2, 2, 2, 2, 2, 2, 2. The x-axis shows values from -0.5 to 1.5. The y-axis shows values from 505.5 to 6214.5. This visualization has the following annotations: <=35; >35; 37; 38; 39; 40; 41; 42; 43; Smoking status (1:Smoker; 2:Non-smoker); Birthweight ini grams