Edit chart
Loading graph
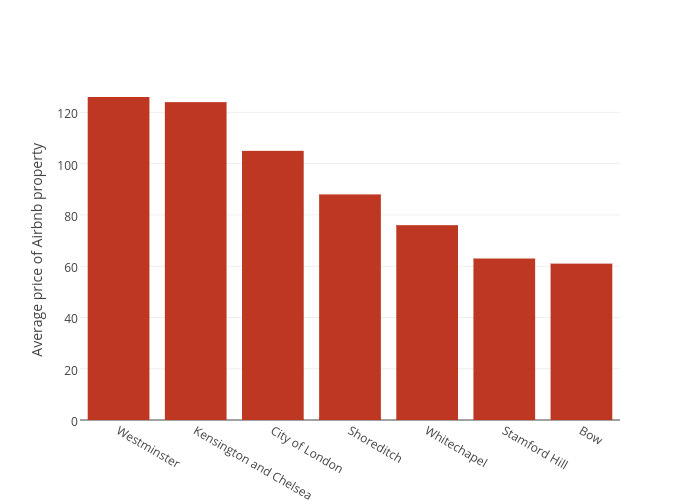
Wfedi001's interactive graph and data of "Col2" is a bar chart, showing Col2; with Average price of Airbnb property in the y-axis. The x-axis shows values from -0.5 to 6.5. The y-axis shows values from 0 to 132.6315789473684.