Edit chart
Loading graph
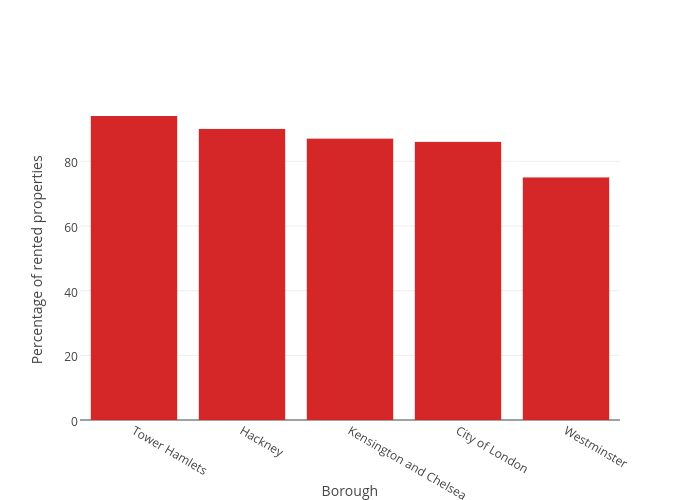
Wfedi001's interactive graph and data of "Percentage of rented properties vs Borough" is a bar chart, showing B; with Borough in the x-axis and Percentage of rented properties in the y-axis.. The x-axis shows values from -0.5 to 4.5. The y-axis shows values from 0 to 98.94736842105263.