Edit chart
Loading graph
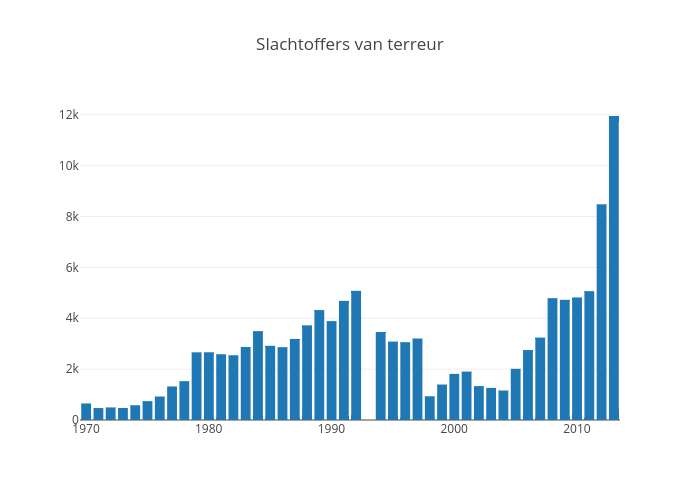
Winnydejong's interactive graph and data of "Slachtoffers van terreur" is a bar chart, showing Col1. The x-axis shows values from 1969.5 to 2013.5. The y-axis shows values from 0 to 12581.052631578947.