Edit chart
Loading graph
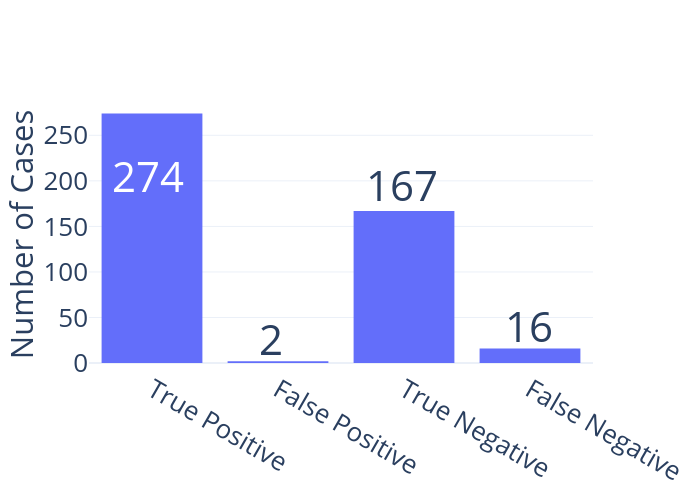
Wjpark2002's interactive graph and data is a bar chart; with Number of Cases in the y-axis. The x-axis shows values from -0.5 to 3.5. The y-axis shows values from -3.3696416022487714 to 288.59840218959204. This visualization has the following annotations: 274; 2; 167; 16