Edit chart
Loading graph
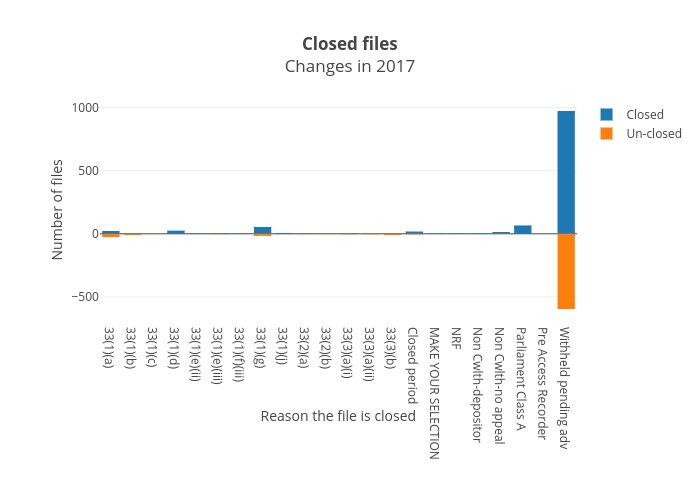
Wragge's interactive graph and data of "Closed filesChanges in 2017" is a , showing Closed vs Un-closed; with Reason the file is closed in the x-axis and Number of files in the y-axis.. The x-axis shows values from 0 to 0. The y-axis shows values from 0 to 0.