Edit chart
Loading graph
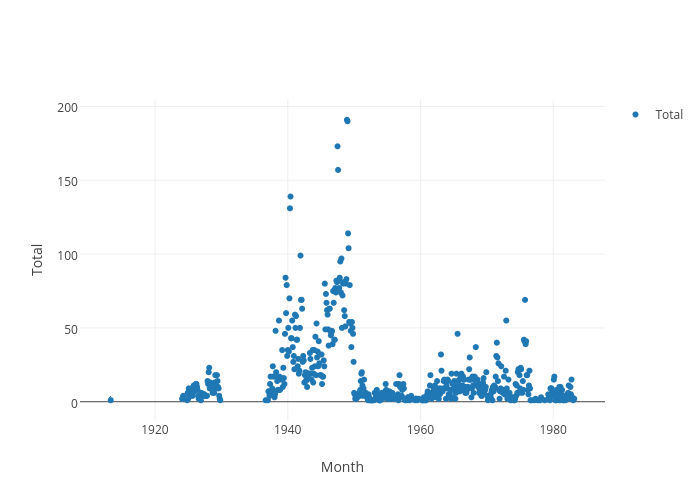
Wragge's interactive graph and data of "Total vs Month" is a scatter chart, showing Total; with Month in the x-axis and Total in the y-axis.. The x-axis shows values from 1909-03-14 03:02:21.9824 to 1987-04-17 20:57:38.0176. The y-axis shows values from -10.91791430046464 to 202.91791430046464.