Edit chart
Loading graph
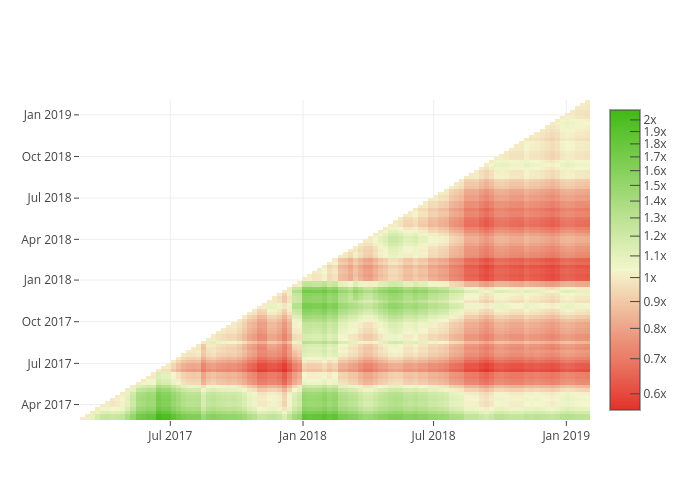
Xoelop's interactive graph and data of "ROI of crypto index funds (no rebalancing) VS ROI of Bitcoin, from mid 2017 on" is a heatmap; with Date@xoelipedes in the x-axis and Date of investment in the y-axis.. The x-axis shows values from 0 to 0. The y-axis shows values from 0 to 0.