Edit chart
Loading graph
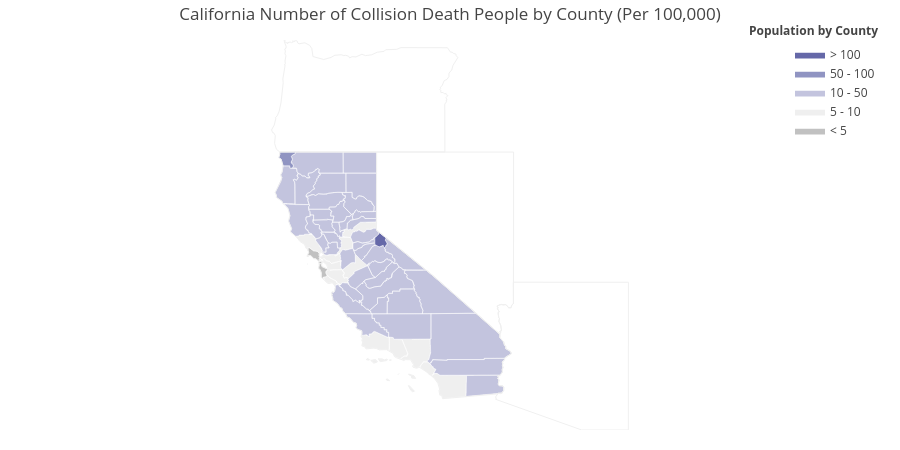
Xuzhaoqing's interactive graph and data of "California Number of Collision Death People by County (Per 100,000)" is a filled line chart, showing 100, US Counties. The x-axis shows values from -135.504654 to -98.105164. The y-axis shows values from 31.332238999999998 to 46.292035. This visualization has the following annotation: Population by County