Edit chart
Loading graph
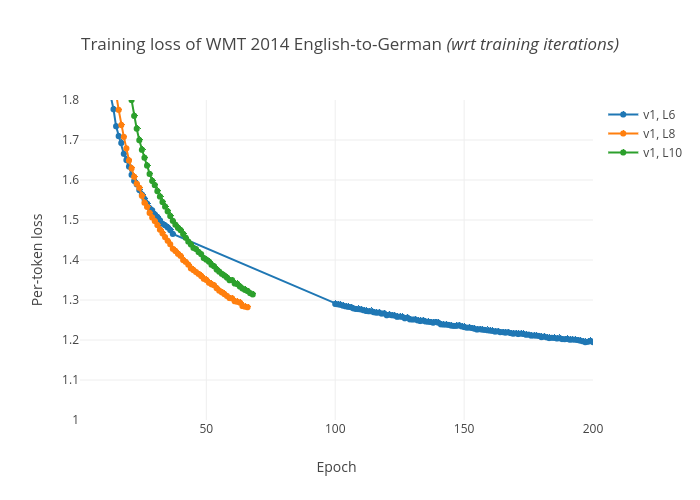
Xyc1207's interactive graph and data of "Training loss of WMT 2014 English-to-German (wrt training iterations)" is a , showing v1, L6, v1, L8, v1, L10; with Epoch in the x-axis and Per-token loss in the y-axis.. The x-axis shows values from 1 to 200. The y-axis shows values from 1 to 1.8.