Edit chart
Loading graph
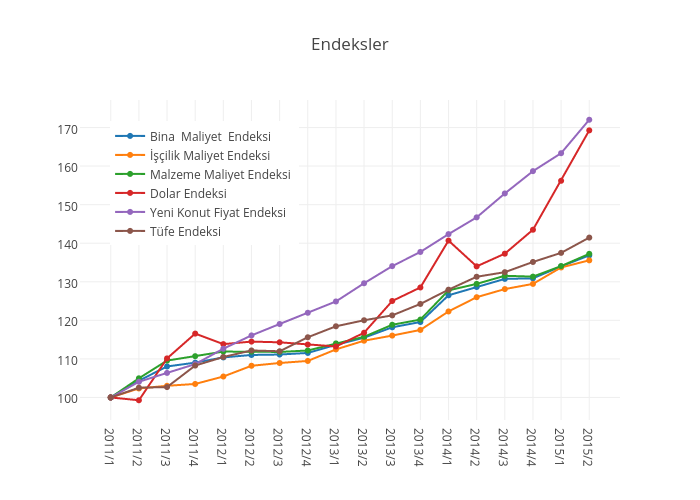
Yasin.engin's interactive graph and data of "Endeksler" is a scatter chart, showing Bina Maliyet Endeksi, İşçilik Maliyet Endeksi, Malzeme Maliyet Endeksi , Dolar Endeksi, Yeni Konut Fiyat Endeksi, Tüfe Endeksi. The x-axis shows values from -1.083578864663131 to 18.08357886466313. The y-axis shows values from 94.07874235474007 to 177.21125764525993.