Edit chart
Loading graph
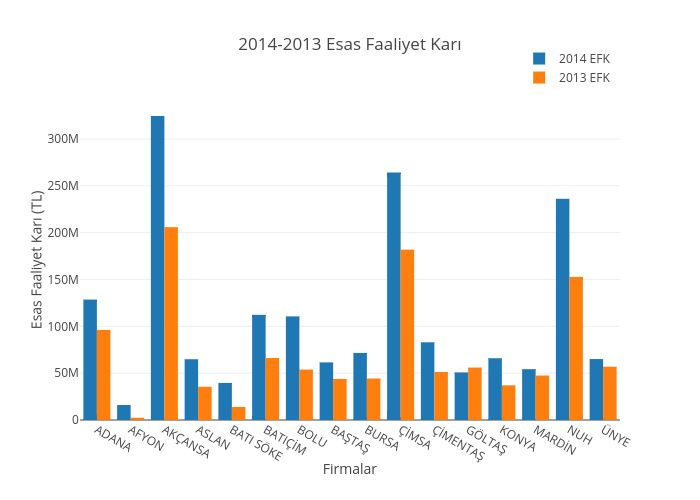
Yasin.engin's interactive graph and data of "2014-2013 Esas Faaliyet Karı" is a bar chart, showing 2014 EFK vs 2013 EFK; with Firmalar in the x-axis and Esas Faaliyet Karı (TL) in the y-axis.. The x-axis shows values from -0.5 to 15.5. The y-axis shows values from 0 to 341511392.6315789.