Edit chart
Loading graph
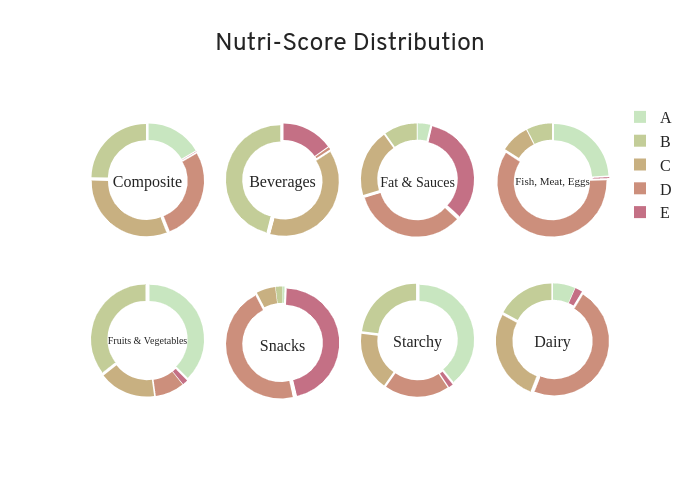
Yohoy's interactive graph and data of "Nutri-Score Distribution" is a pie, showing Composite, Beverages, Fat & Sauces, Fish, Meat, Eggs, Fruits & Vegetables, Snacks, Starchy, Dairy. The x-axis shows values from -0.5 to 6.5. The y-axis shows values from 0 to 211.57894736842104.