Edit chart
Loading graph
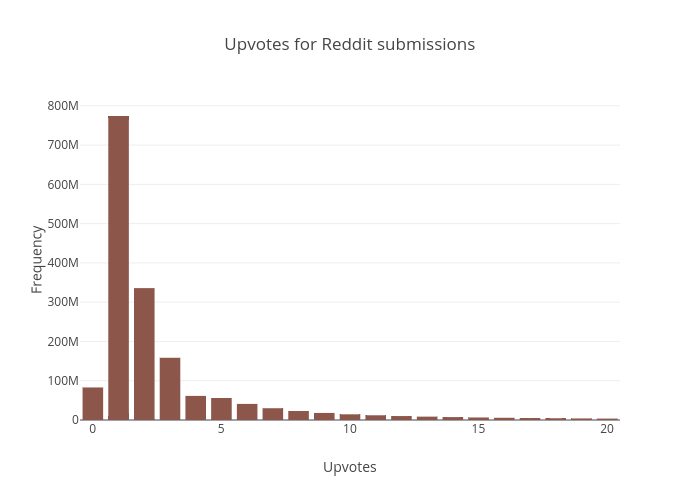
Yuguang's interactive graph and data of "Upvotes for Reddit submissions" is a bar chart, showing trace 0; with Upvotes in the x-axis and Frequency in the y-axis.. The x-axis shows values from -1 to 6. The y-axis shows values from -1 to 4.