Edit chart
Loading graph
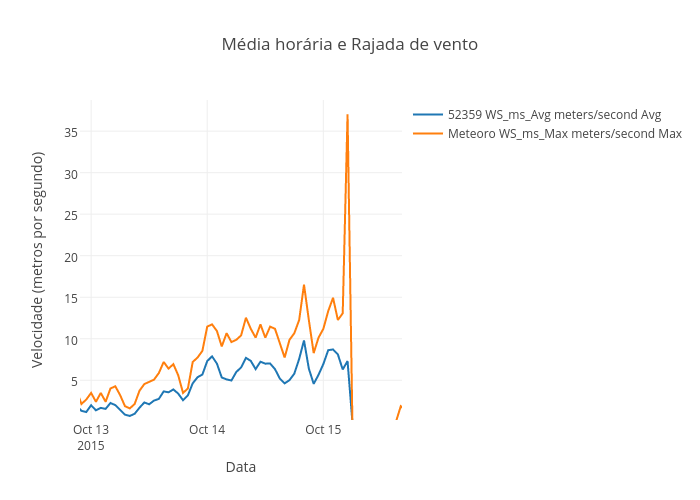
Zrhans's interactive graph and data of "Média horária e Rajada de vento" is a scatter chart, showing 52359 WS_ms_Avg meters/second Avg vs Meteoro WS_ms_Max meters/second Max; with Data in the x-axis and Velocidade (metros por segundo) in the y-axis.. The x-axis shows values from 1444686137572.3823 to 1444925709681.4866. The y-axis shows values from 0.2145473793633732 to 38.750490991444956.