Edit chart
Loading graph
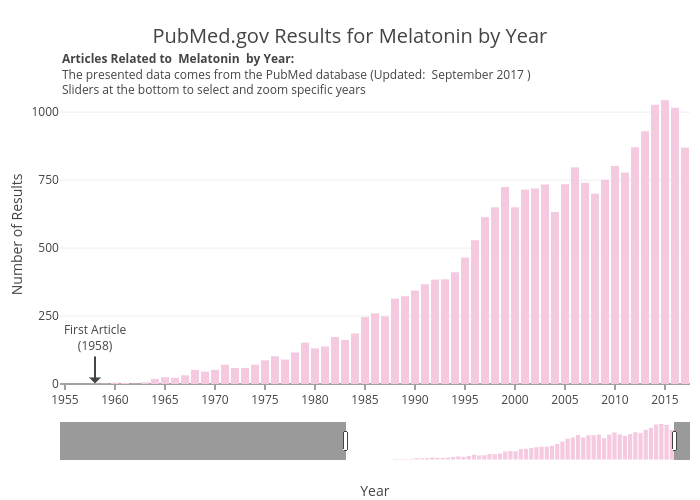
Zwintrob's interactive graph and data of "PubMed.gov Results for Melatonin by Year" is a bar chart; with Year in the x-axis and Number of Results in the y-axis.. The x-axis shows values from 1954.5 to 2017.5. The y-axis shows values from 0 to 1100. This visualization has the following annotations: Articles Related to Melatonin by Year:The presented data comes from the PubMed database (Updated: September 2017 )Sliders at the bottom to select and zoom specific years; First Article(1958)