Edit chart
Loading graph
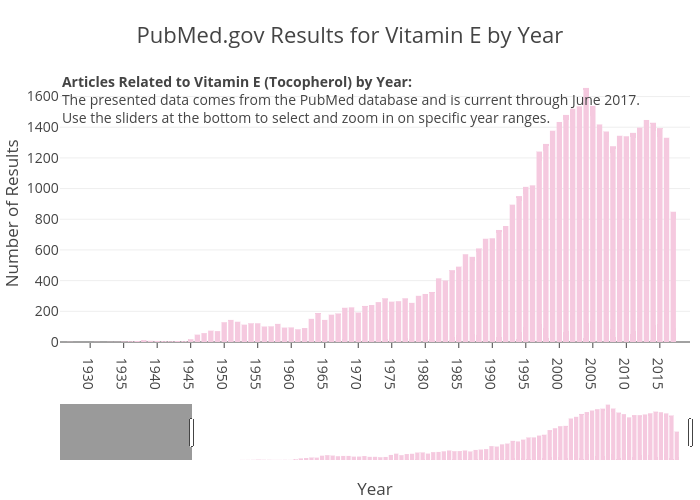
Zwintrob's interactive graph and data of "PubMed.gov Results for Vitamin E by Year" is a bar chart; with Year in the x-axis and Number of Results in the y-axis.. The x-axis shows values from 1925.5 to 2019.5. The y-axis shows values from 0 to 1675. This visualization has the following annotation: Articles Related to Vitamin E (Tocopherol) by Year: The presented data comes from the PubMed database and is current through June 2017. Use the sliders at the bottom to select and zoom in on specific year ranges.