Plotly Professional Services
Partner with us to design, develop, and deploy powerful data applications on Dash Enterprise. Our team of experts do it all, guiding you through proof of concepts or scaling enterprise analytics products. Deliver fast, secure, and beautifully interactive apps that run well and look good.
Data App Development
Analytical Dash apps are the human interface layer for data, analytics, AI, and ML. Our clients choose Plotly for delivering data apps because we're unbeatable in three core areas.
- Speed and efficiency of delivery: Our customers are consistently blown away by our beautiful and responsive analytical apps delivered in days, not months.
- Expertise: We have worked on hundreds of projects in the finance, tech, oil & gas, manufacturing, and government sectors. Your project can’t be in better hands.
- Future Proof: We use open source technologies and utilize frameworks like Python that data scientists already use and understand.
Software Development
Using the Dash Enterprise framework, we transform your models and ideas into polished apps that integrate into your organization's internal processes and systems.
Meet some of our experts!
Yves Blain-Montesano
Solutions Architect
Yves Blain-Montesano
Solutions Architect


Recent Projects
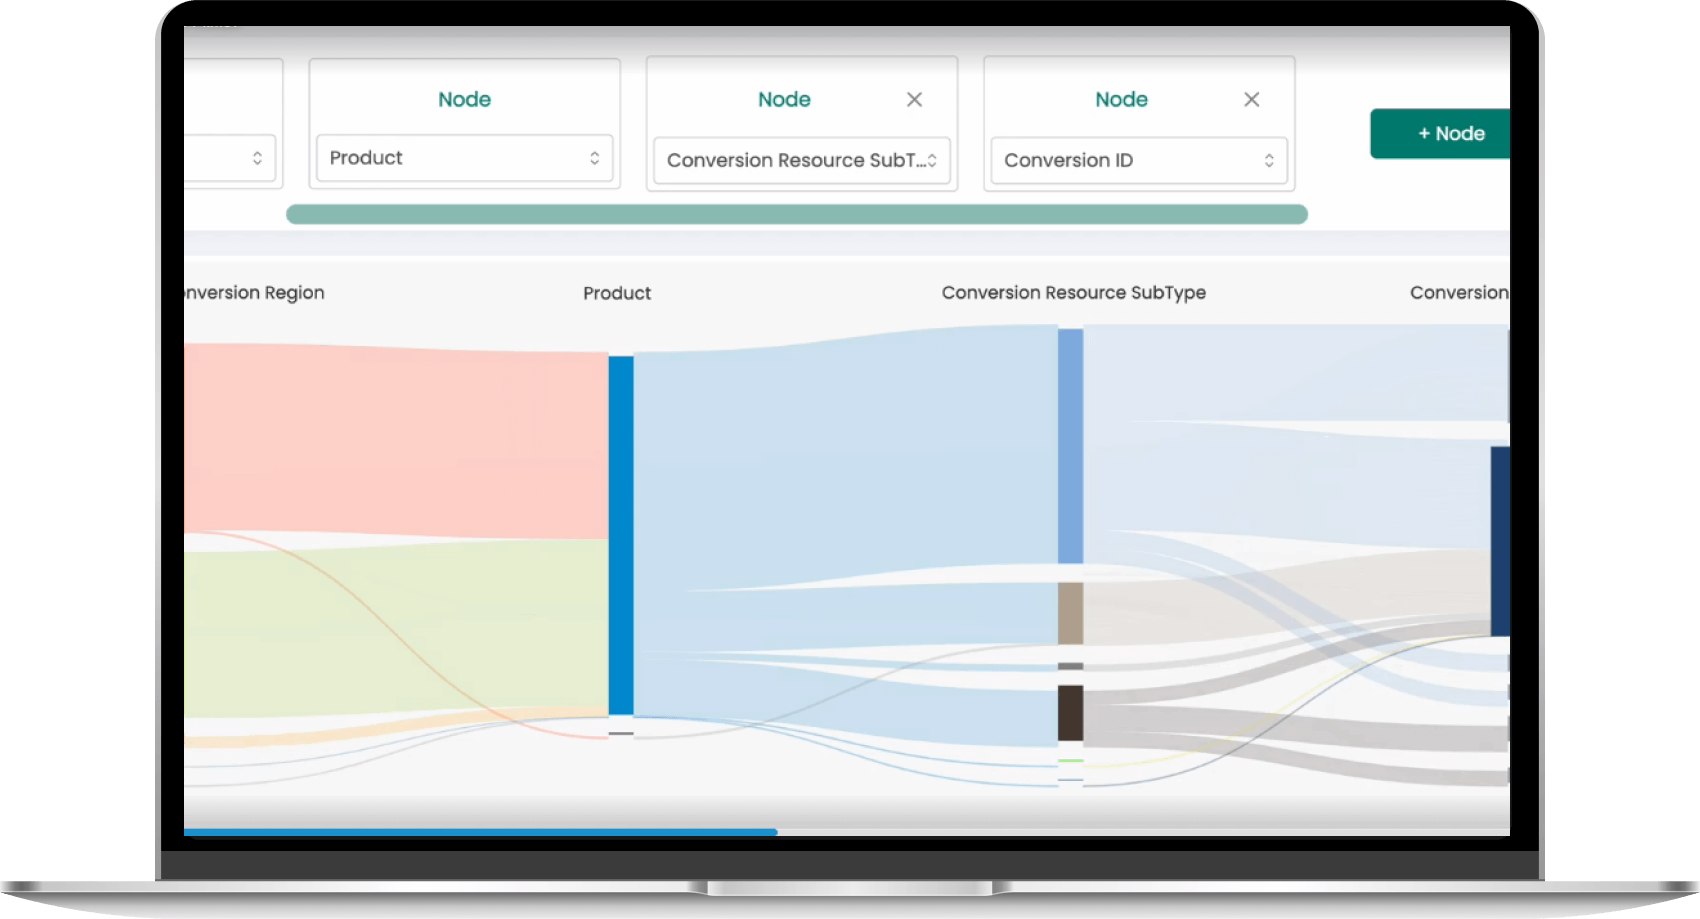
Deep Dive on Sankey Diagrams
- Plotly Professional Services walks through Sankey Diagram best practices and use cases, providing data structure background and starter code to gain valuable insights from data.
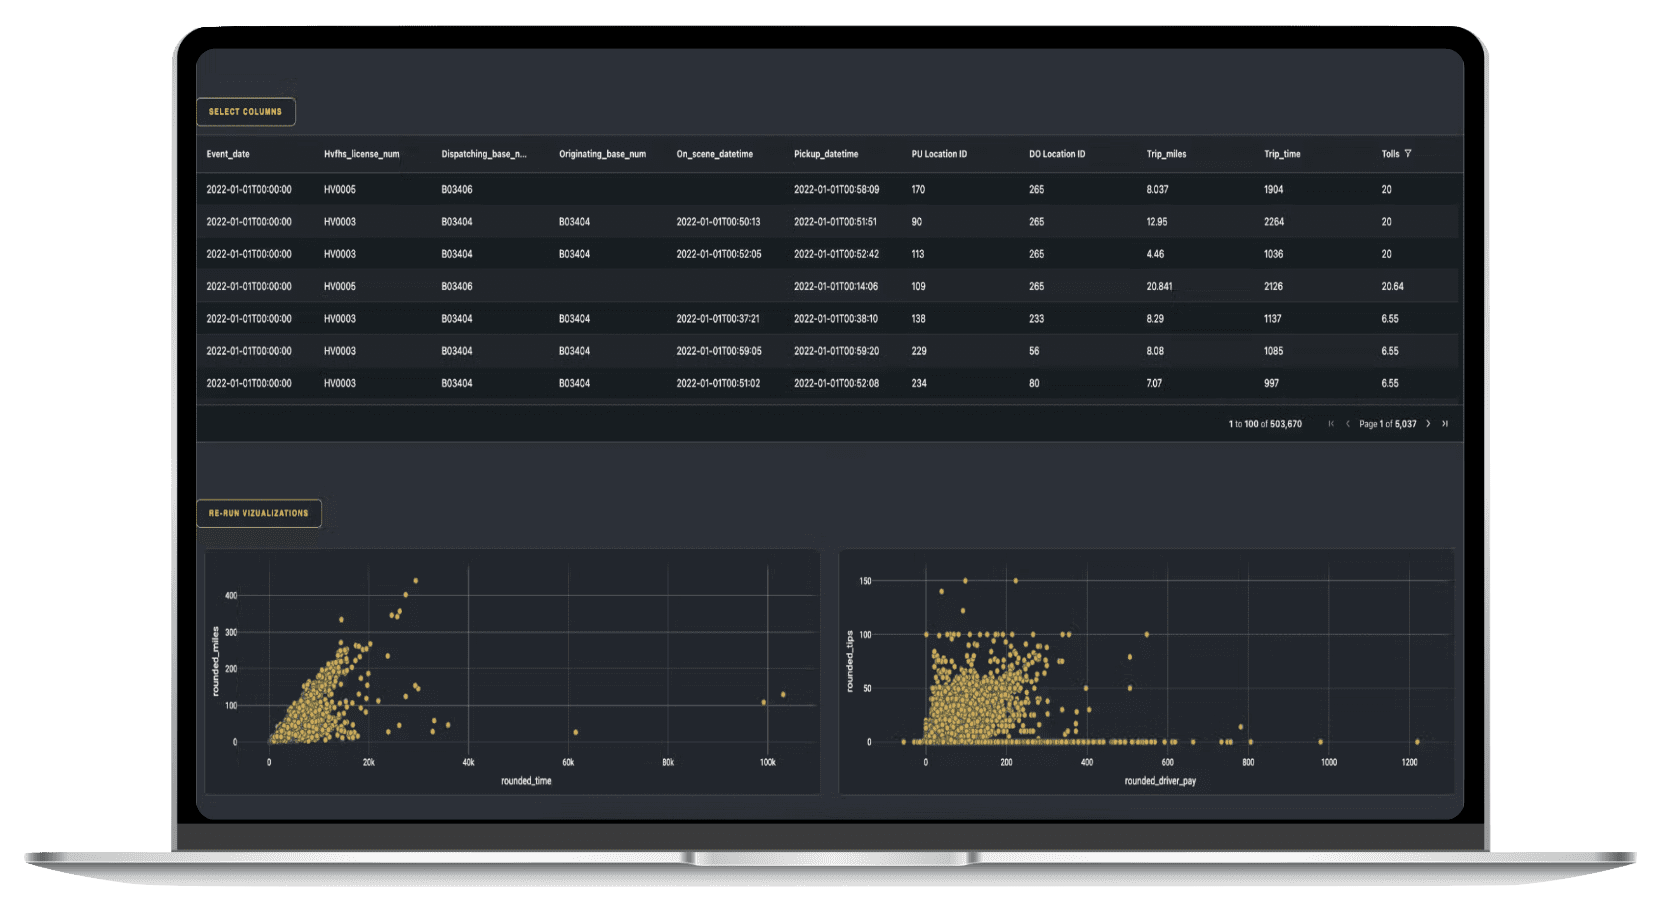
How Polars Can Help You Build Fast Dash Apps for Large Datasets
- Discover the power of leveraging Polars in lightning-fast Dash apps for visualizing and analyzing large data sets in your production environment.
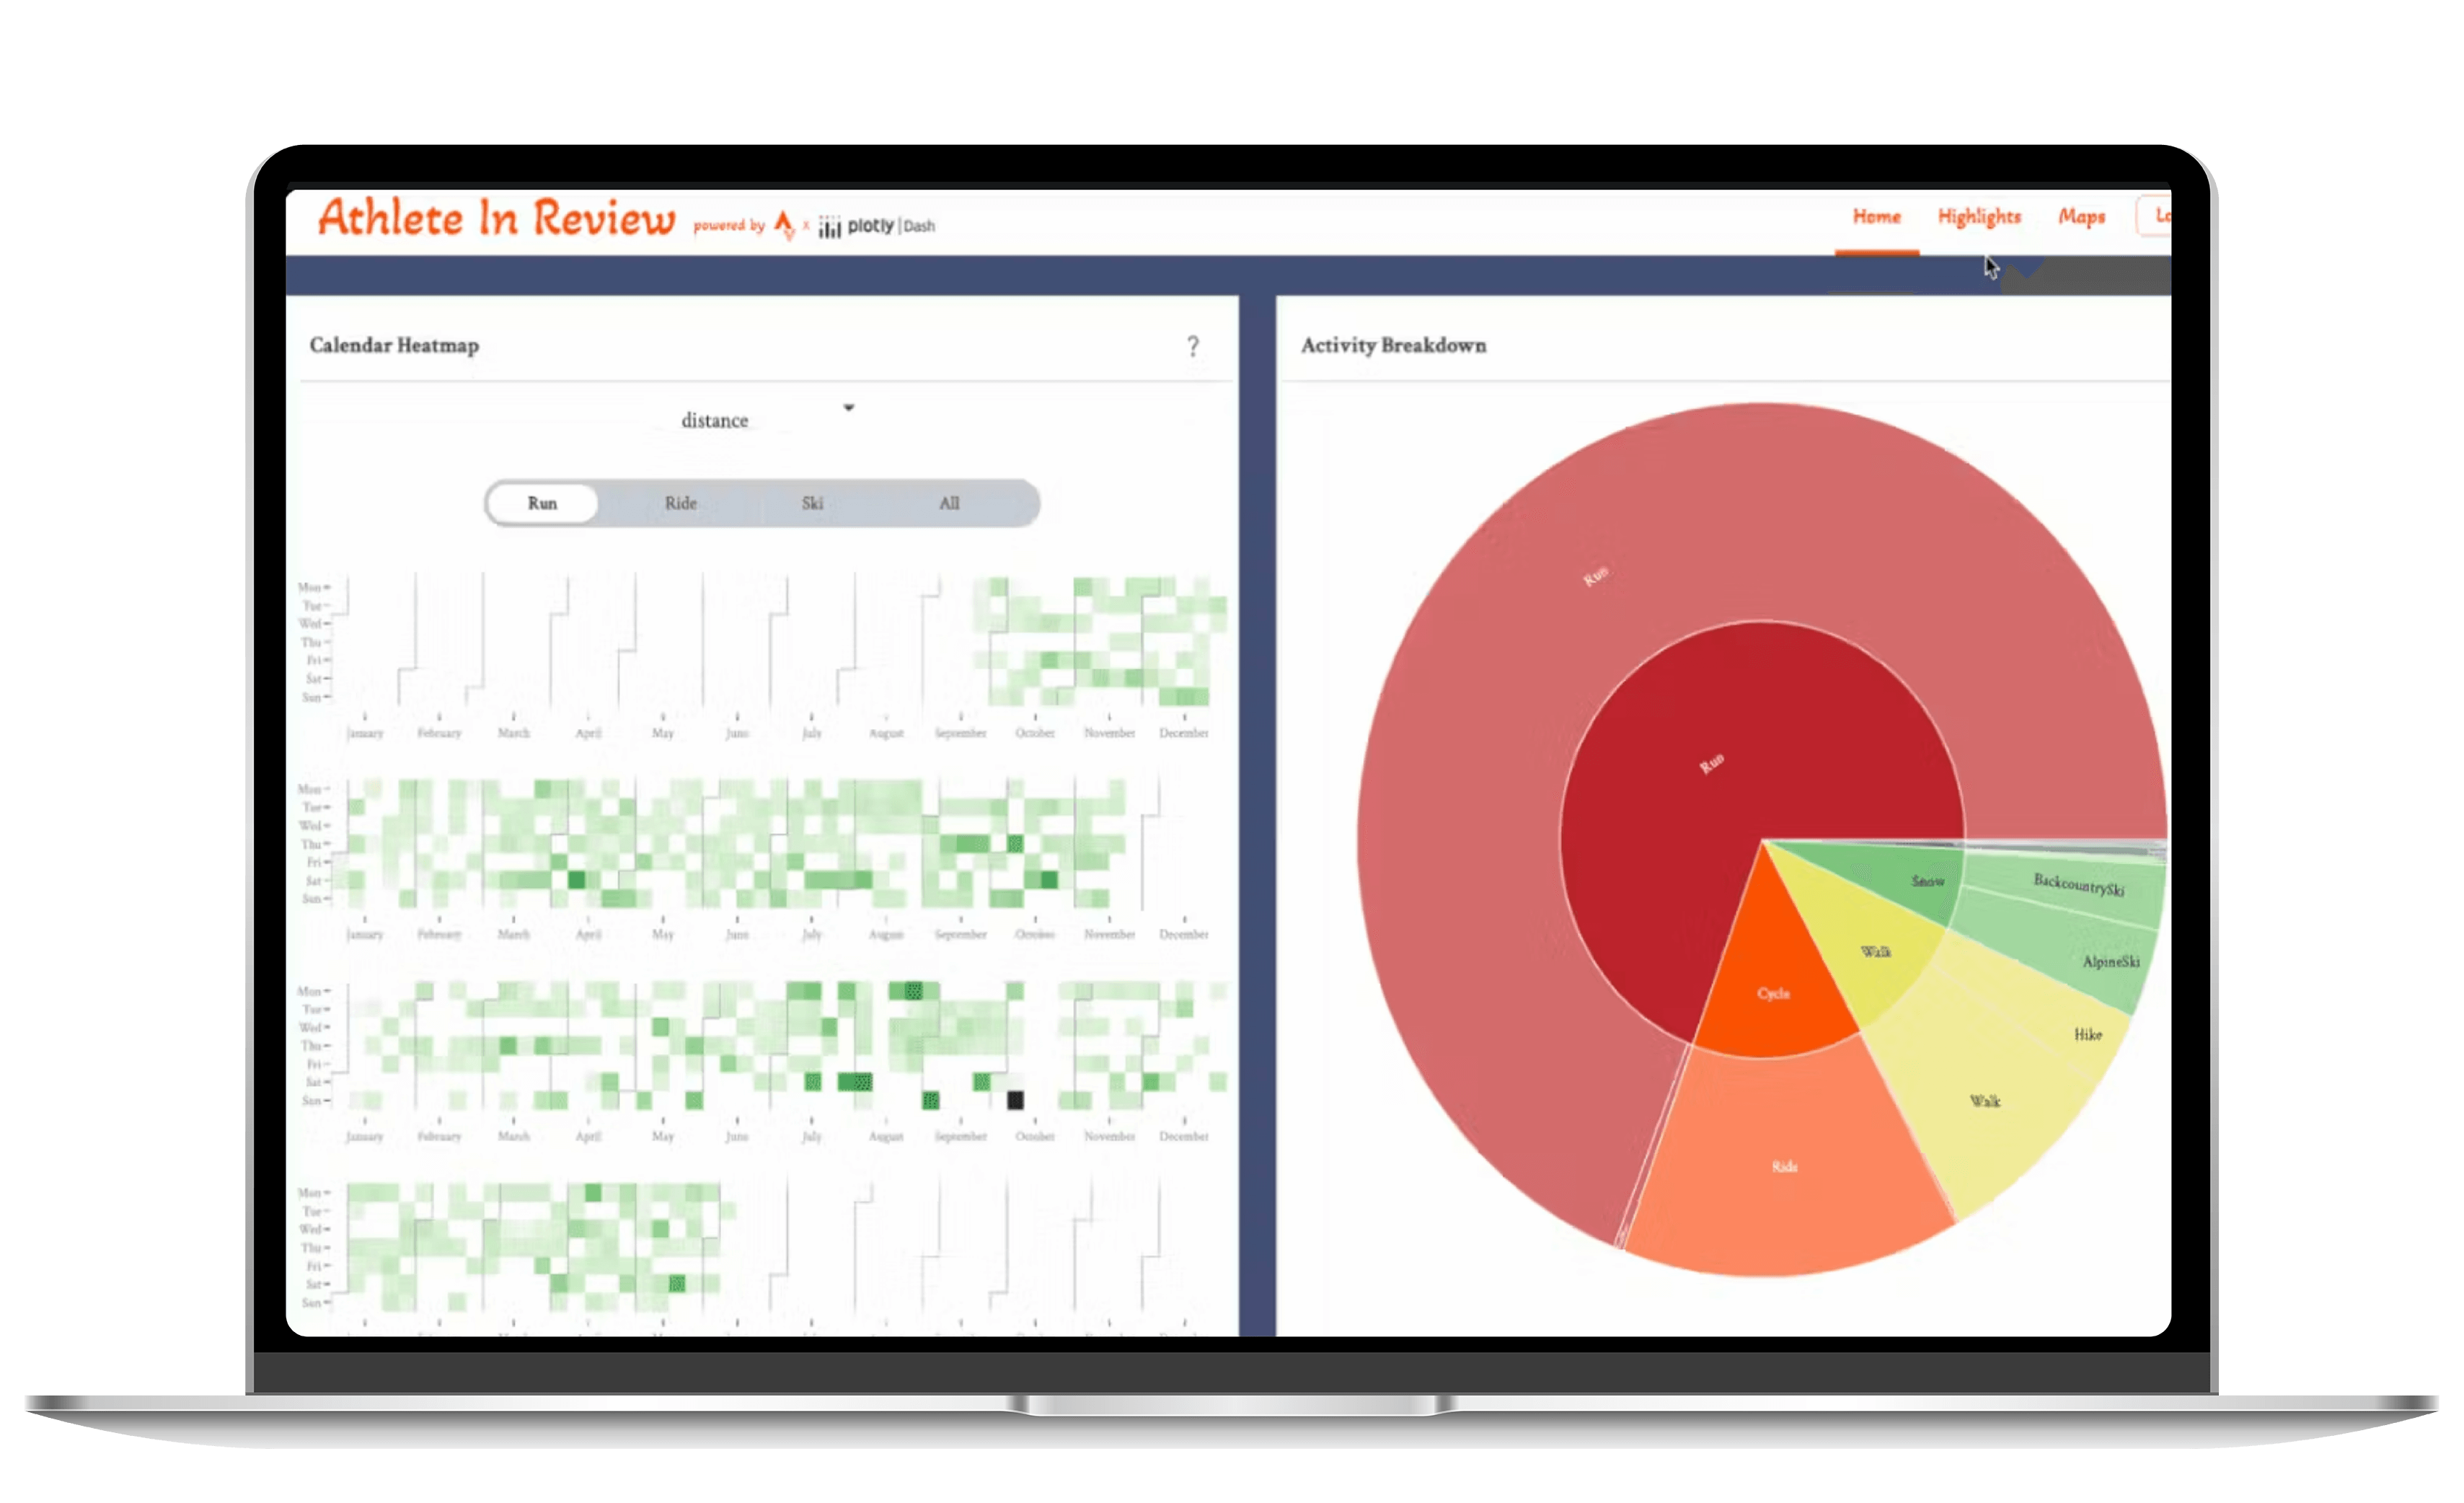
Reflections from an Athlete — Dash feat. Strava
- Follow along with a former Plotly Professional Services team member, Anna Riley, as she visualizes her personal Strava data with Dash. Anna extended her app to benefit the Strava community in just two weeks.
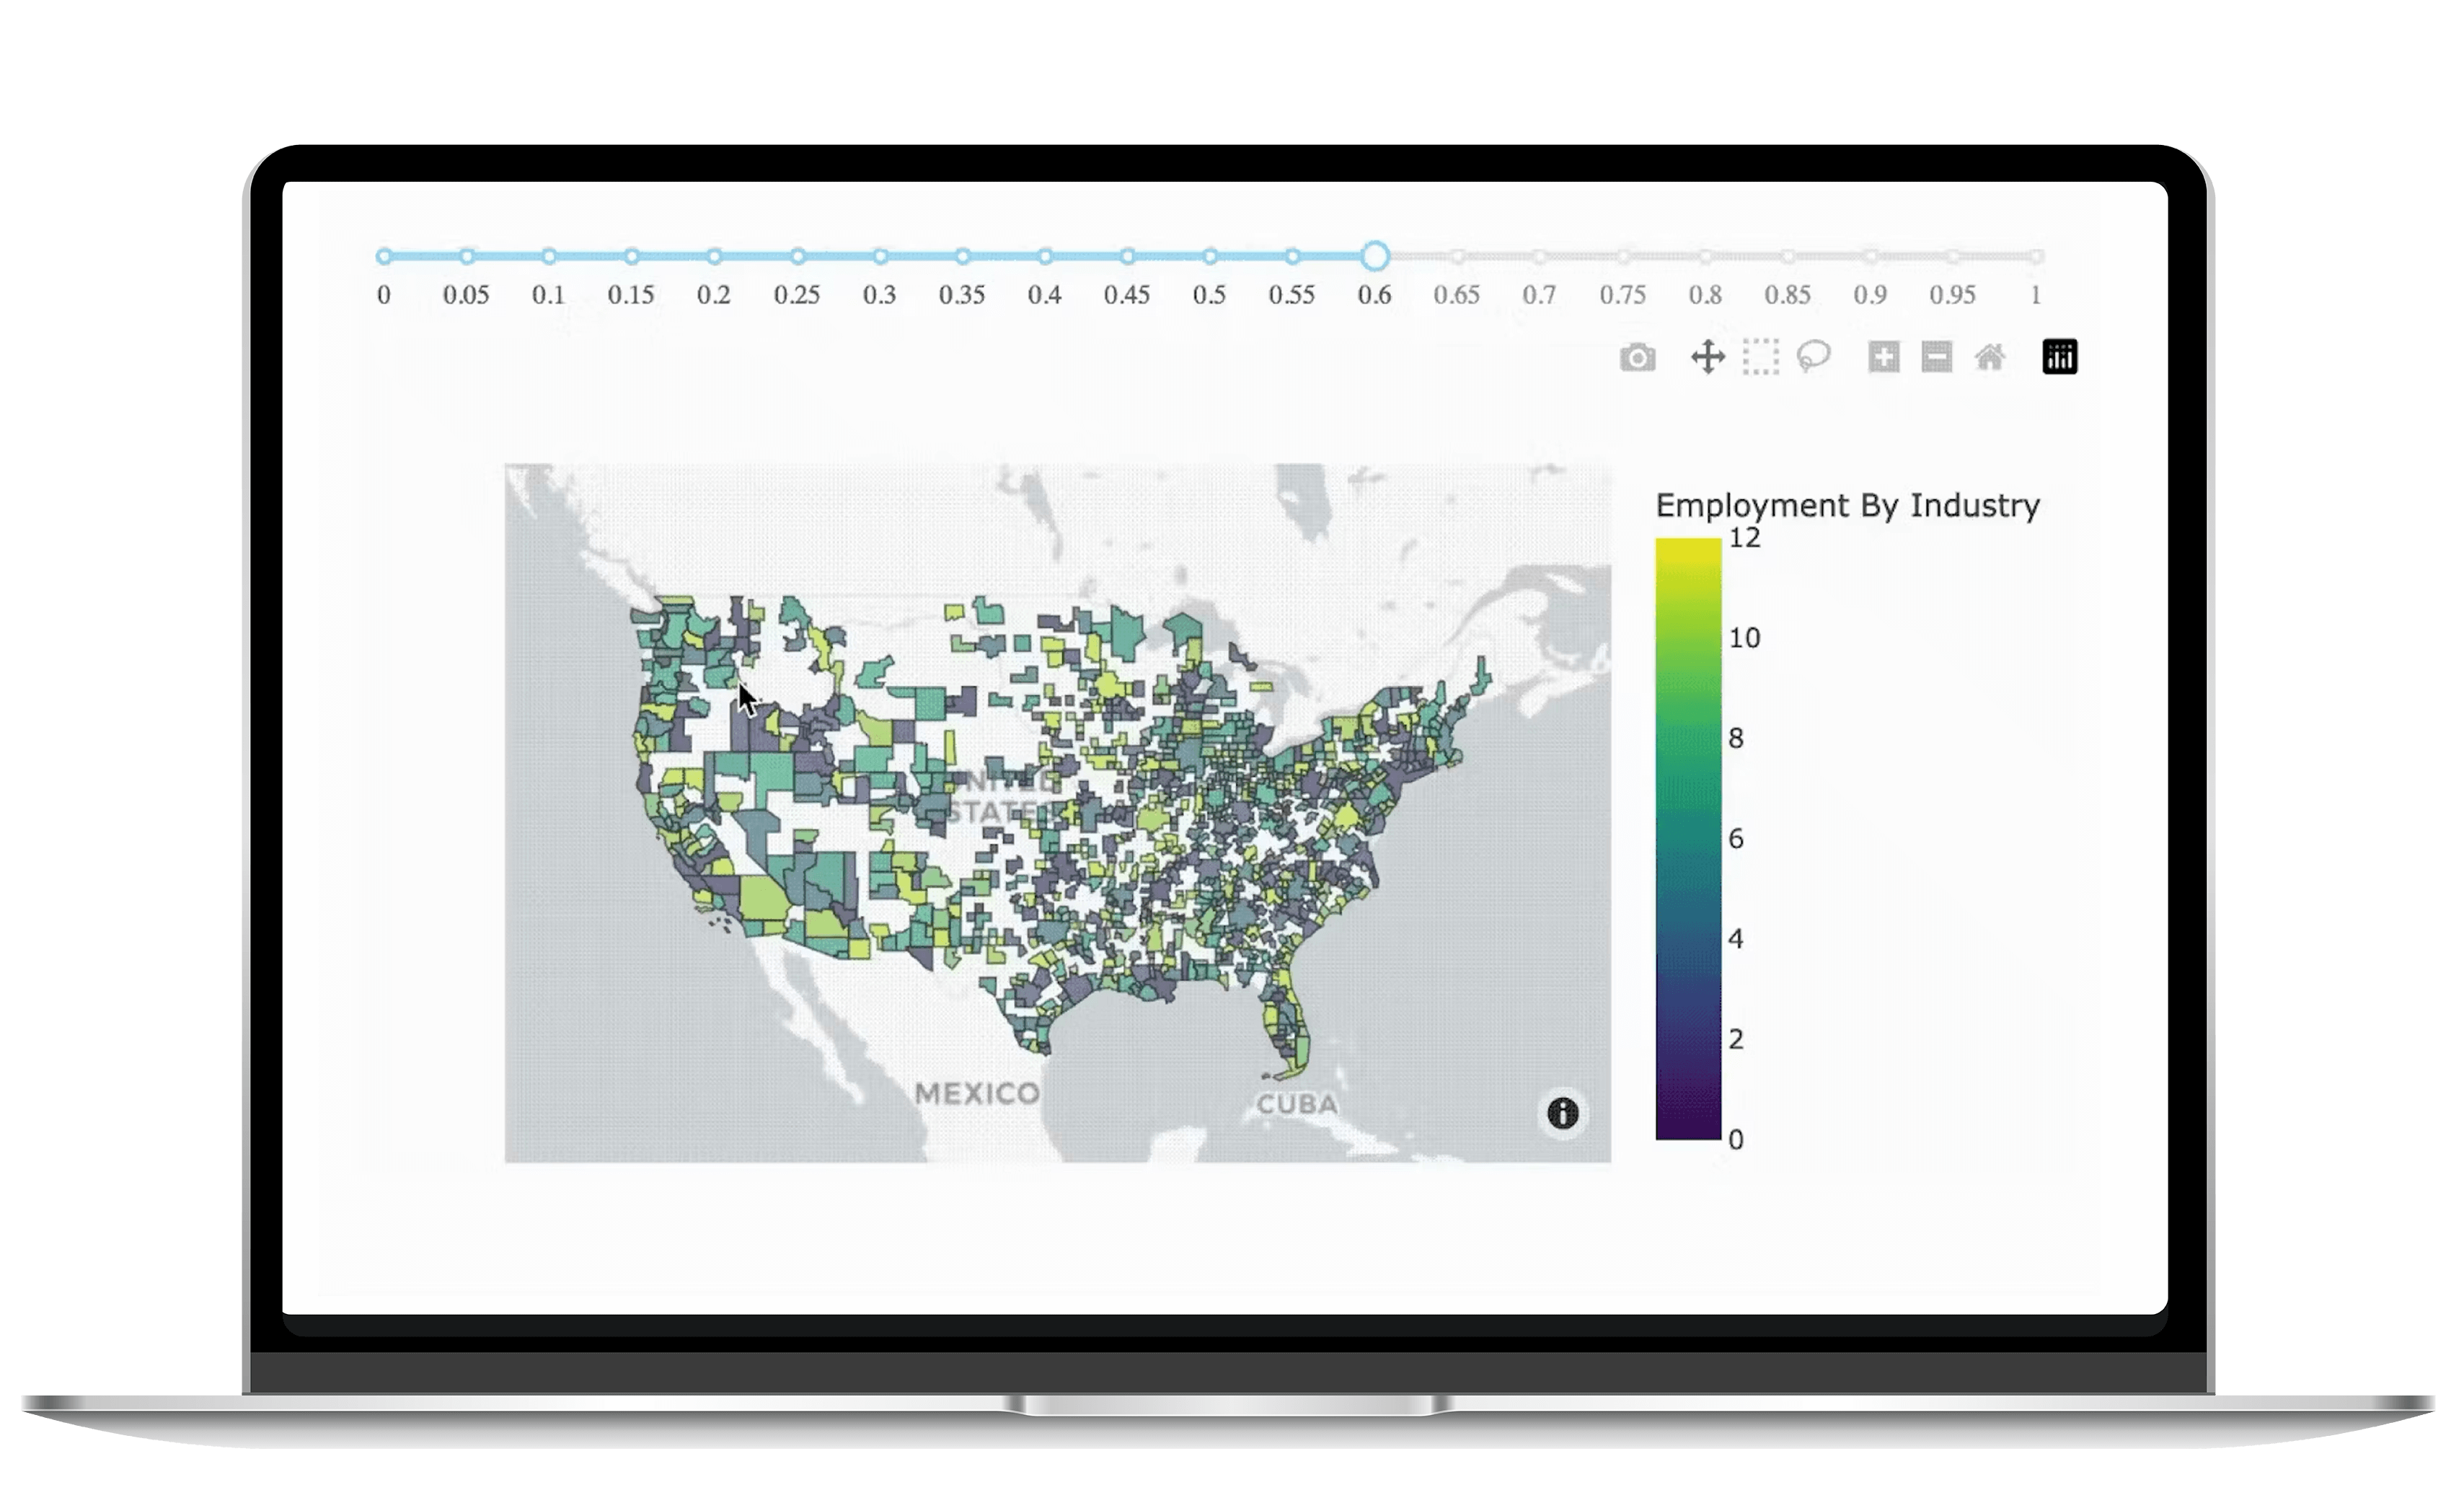
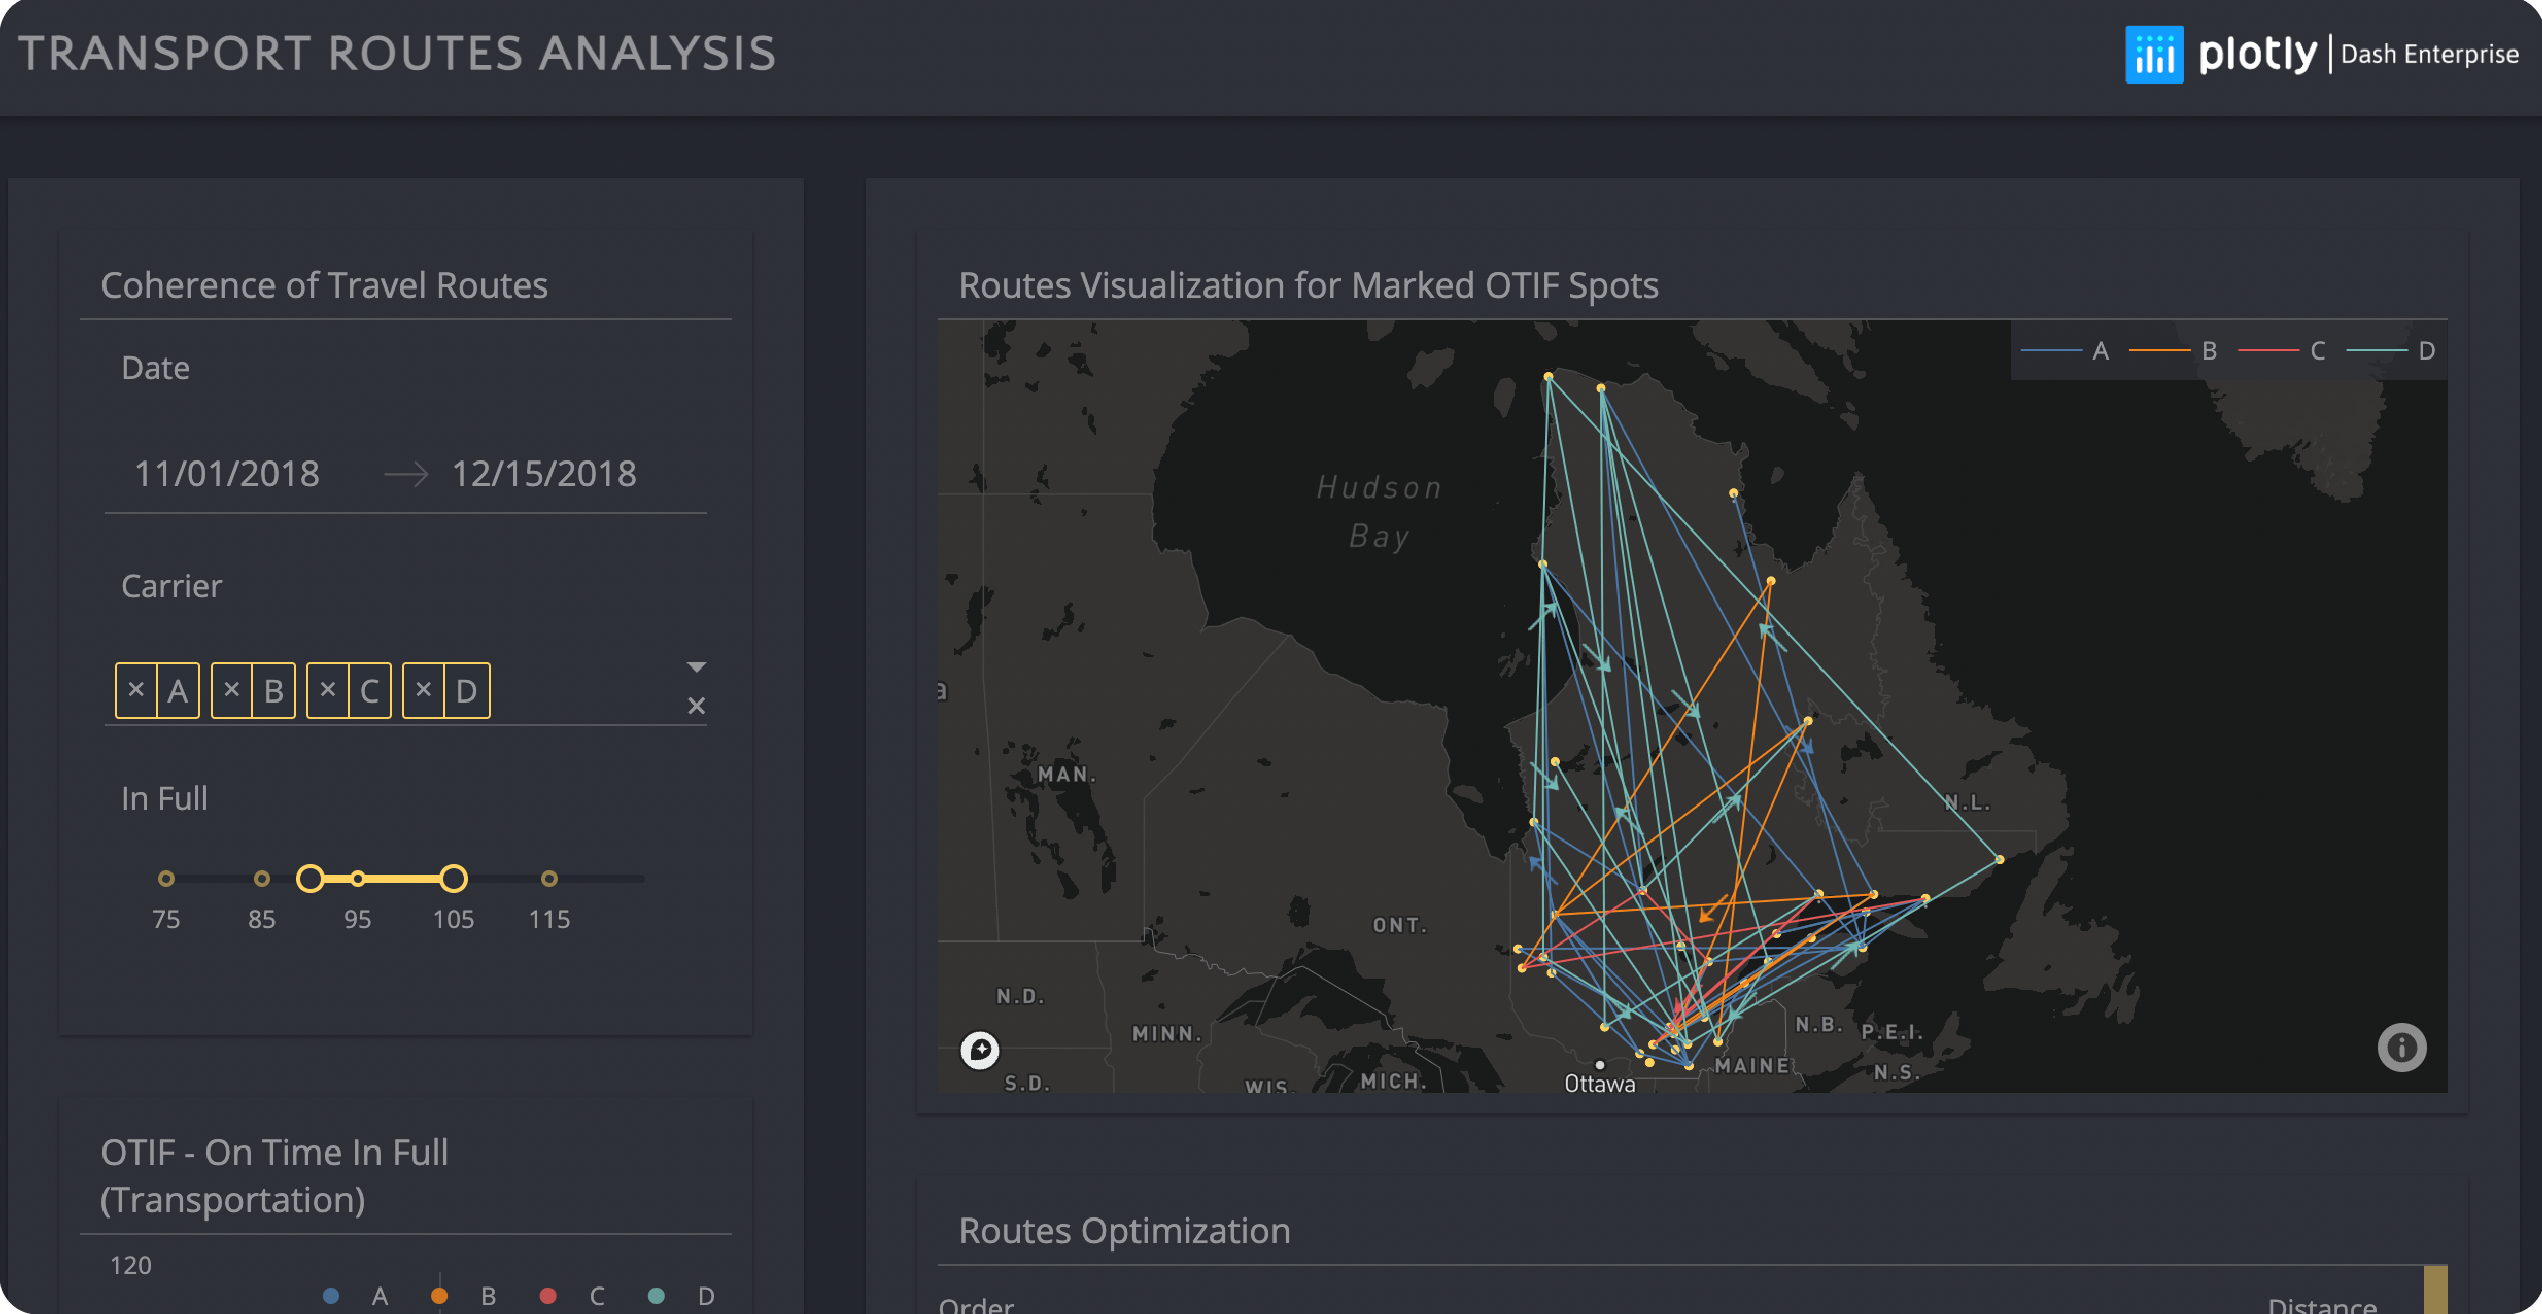
Performance Optimizations for Geospatial Dash Apps
- The Plotly Professional Services team wrote an article about best ways to optimize performance for geospatial apps. Read the deep dive on vector, polygon data area boundaries which are used for countries, provinces, or states.
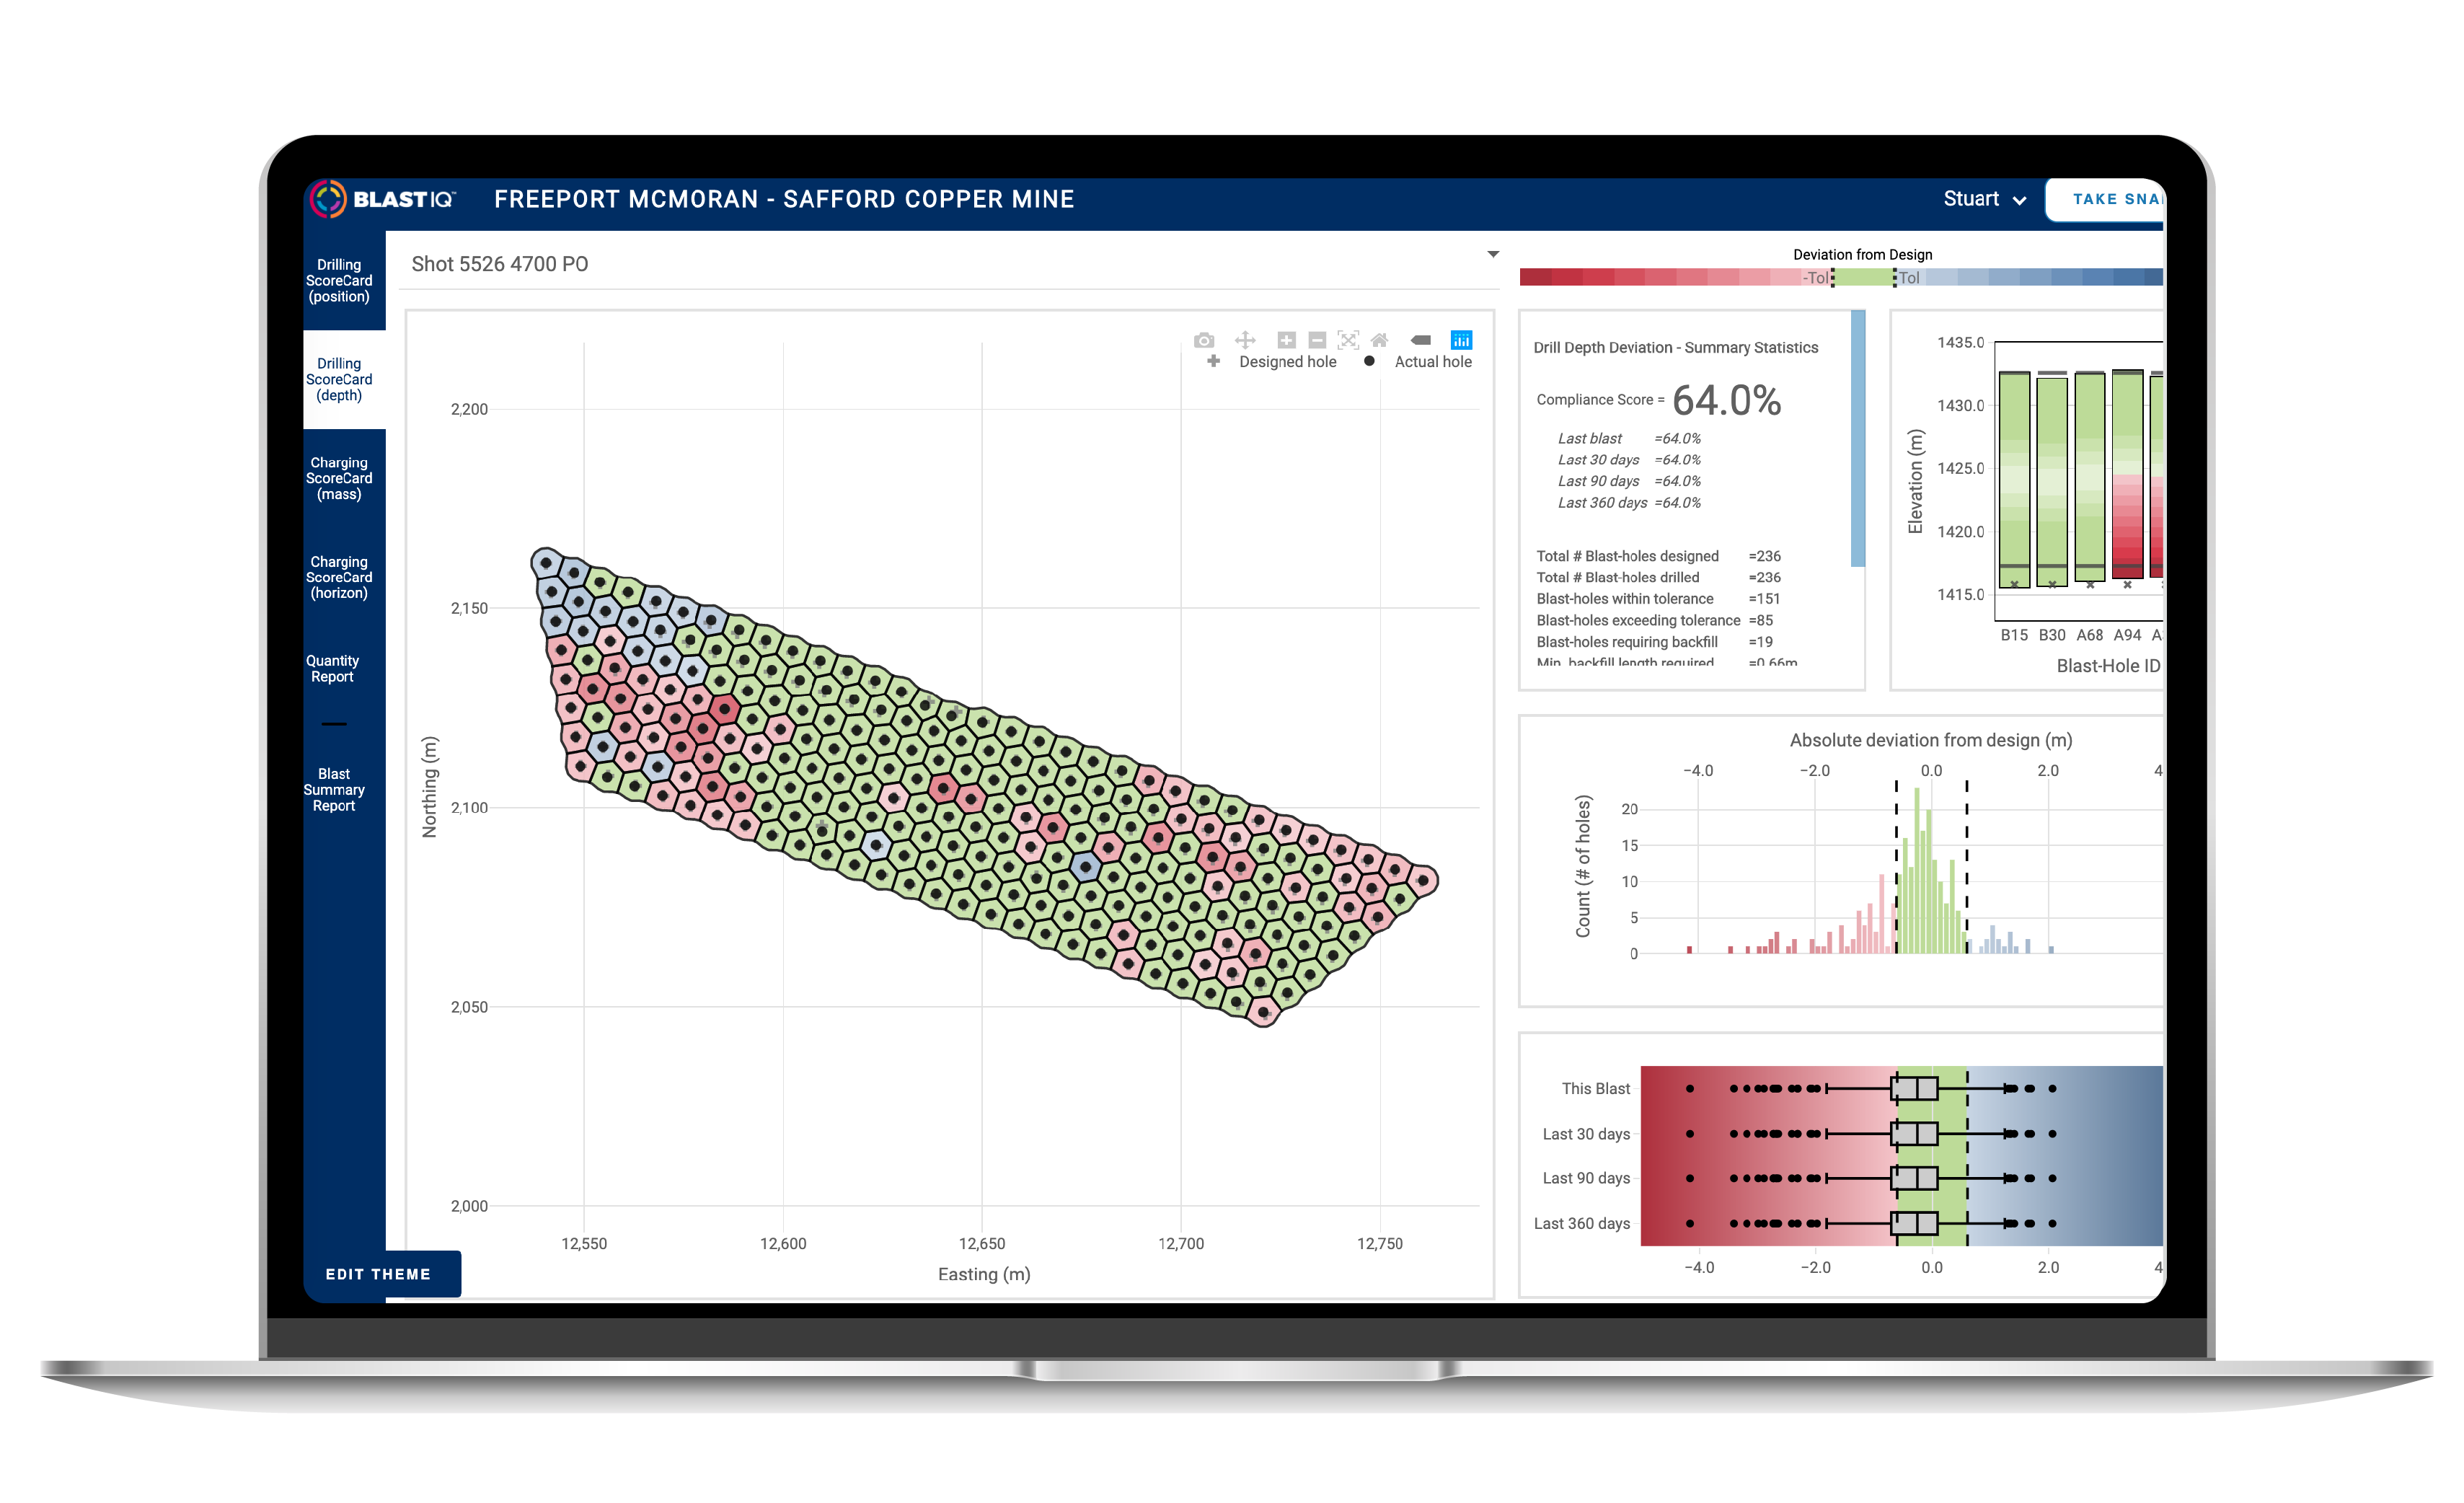
Orica - BlastIQ
- Orica was looking to improve the blasting and drilling processes at one of their customer's mining operations. They needed to better visualize the execution of actual vs design blast data. Plotly's Professional Services team delivered a Dash app that provided valuable information on the implementation against design tolerances to establish a benchmark for improvement.
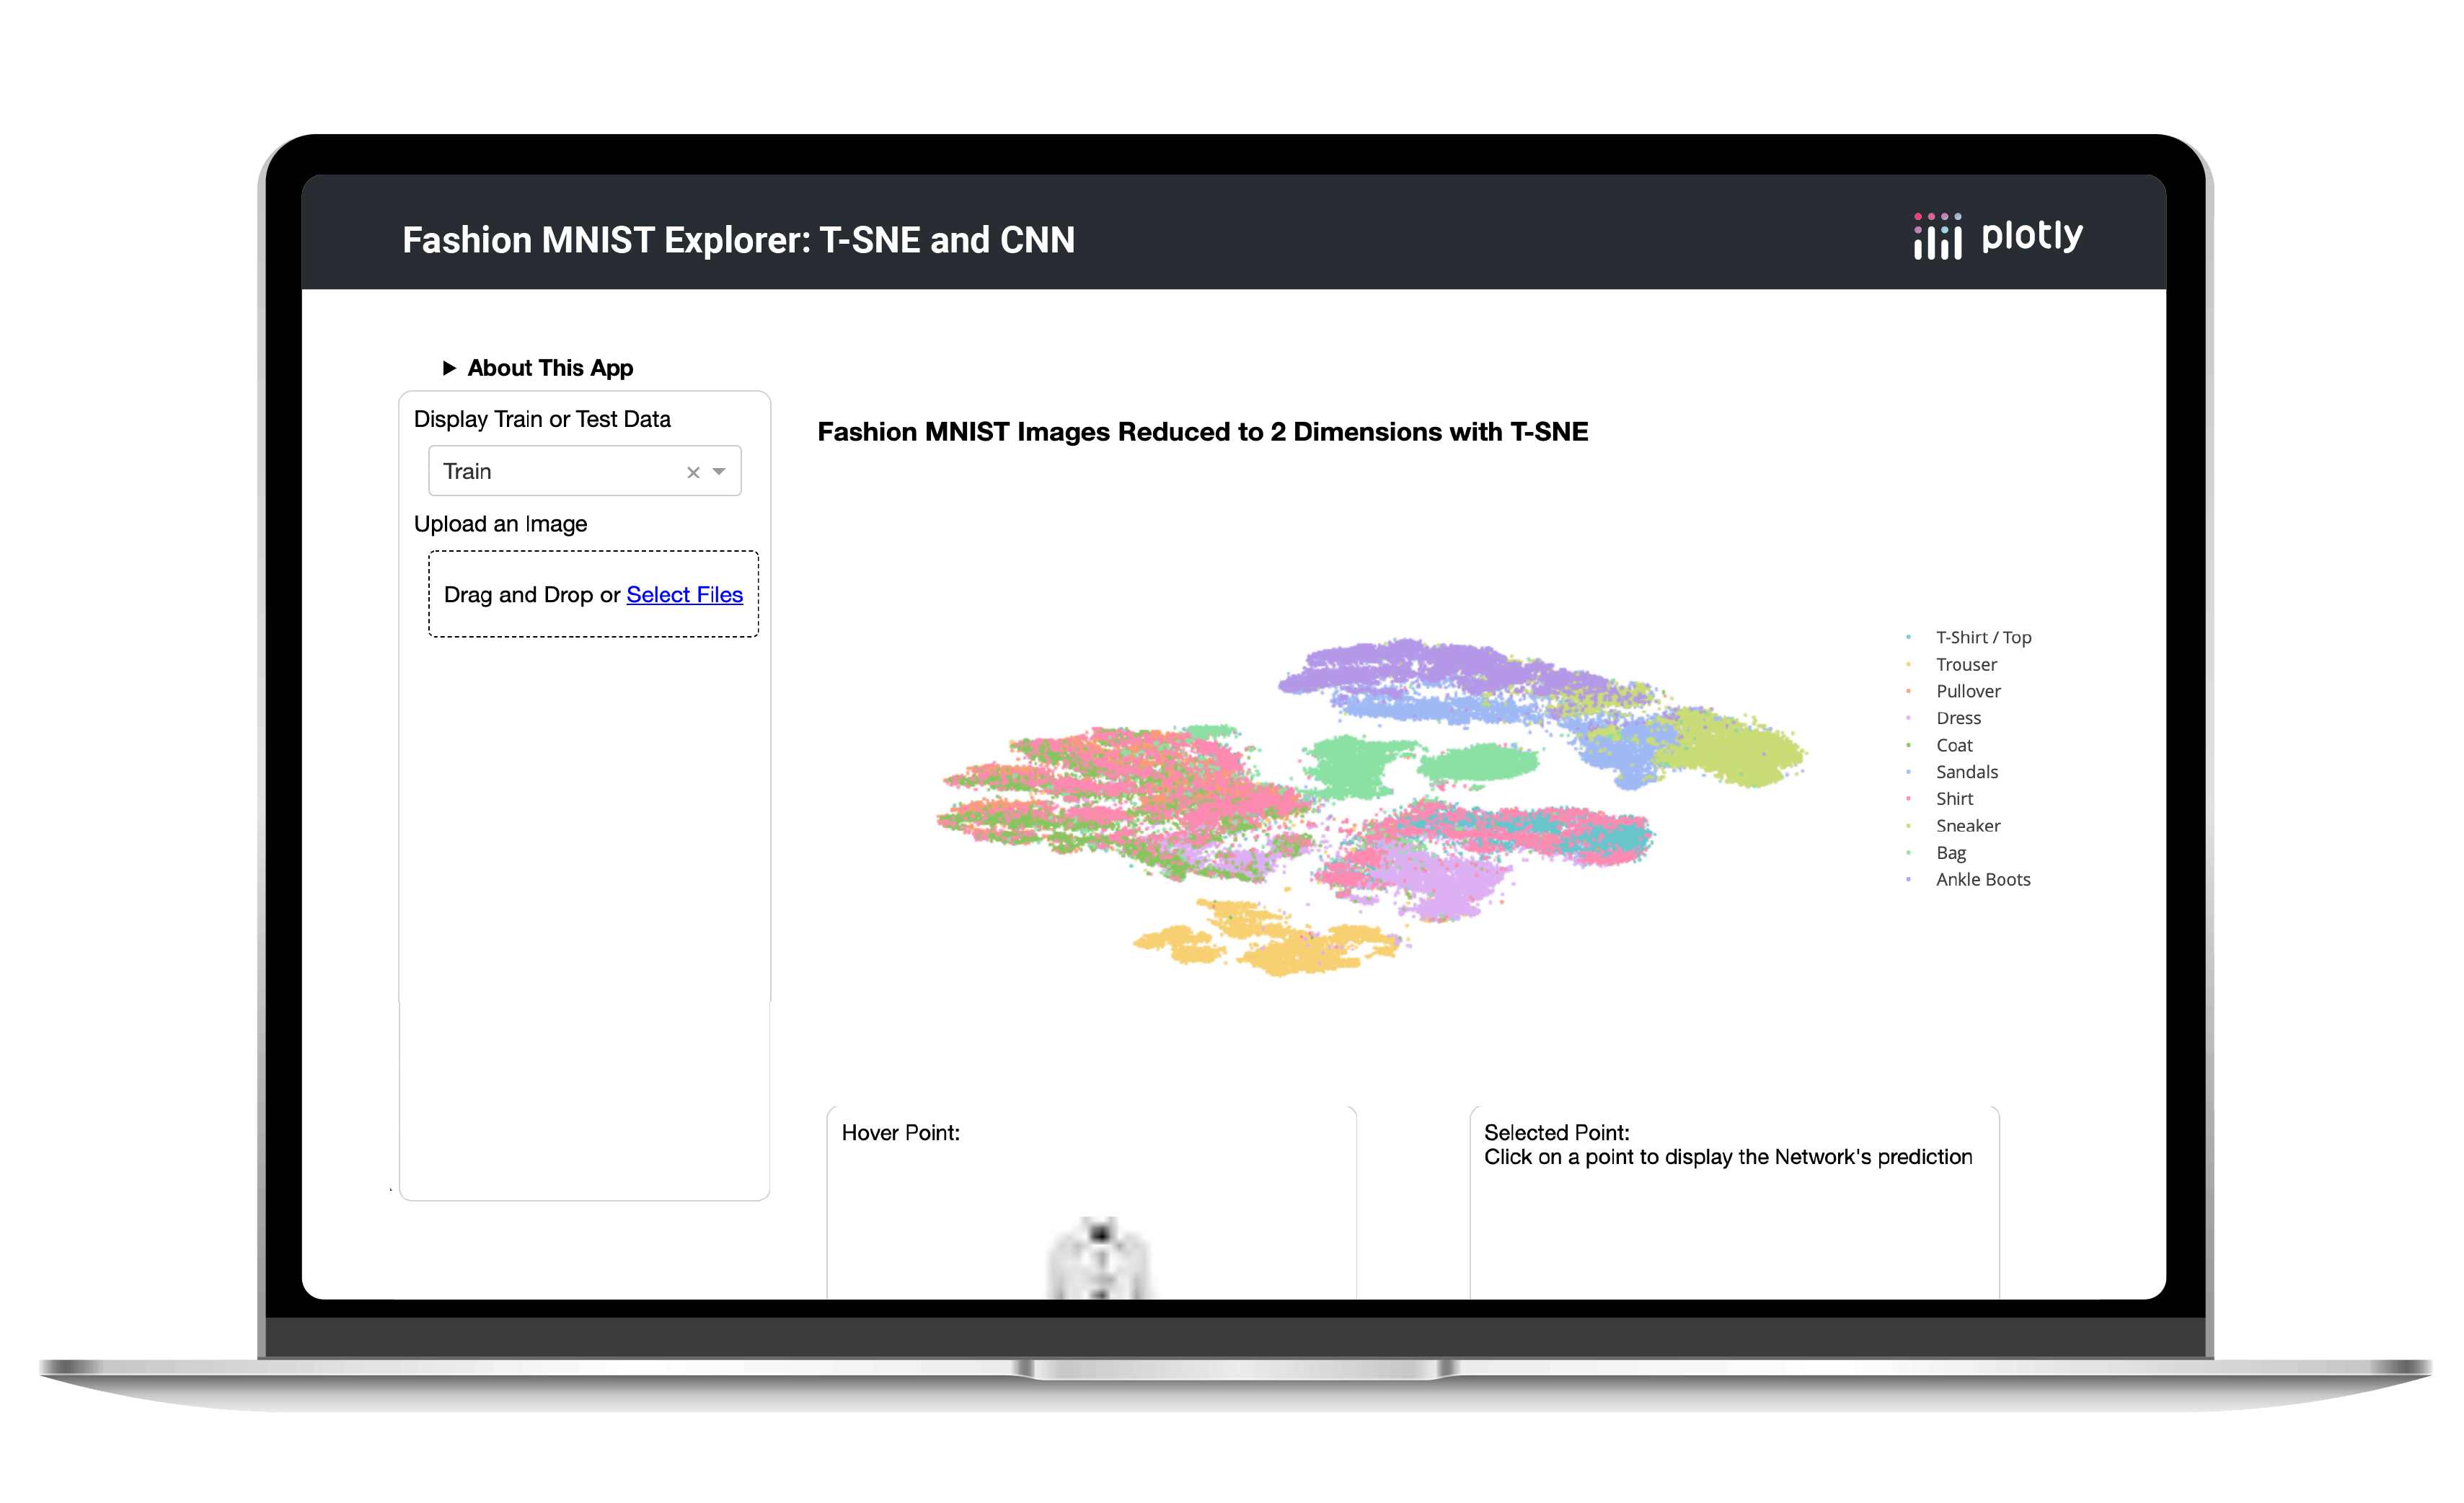
Dex Clothing - MNIST Explorer
- Dex Clothing needed to optimize their garment-sorting process. Plotly's Professional Services helped Dex implement an AI visual search system to better categorize their garment images. The result of this Dash app was an automated image categorization process and streamlined supply chain operations.
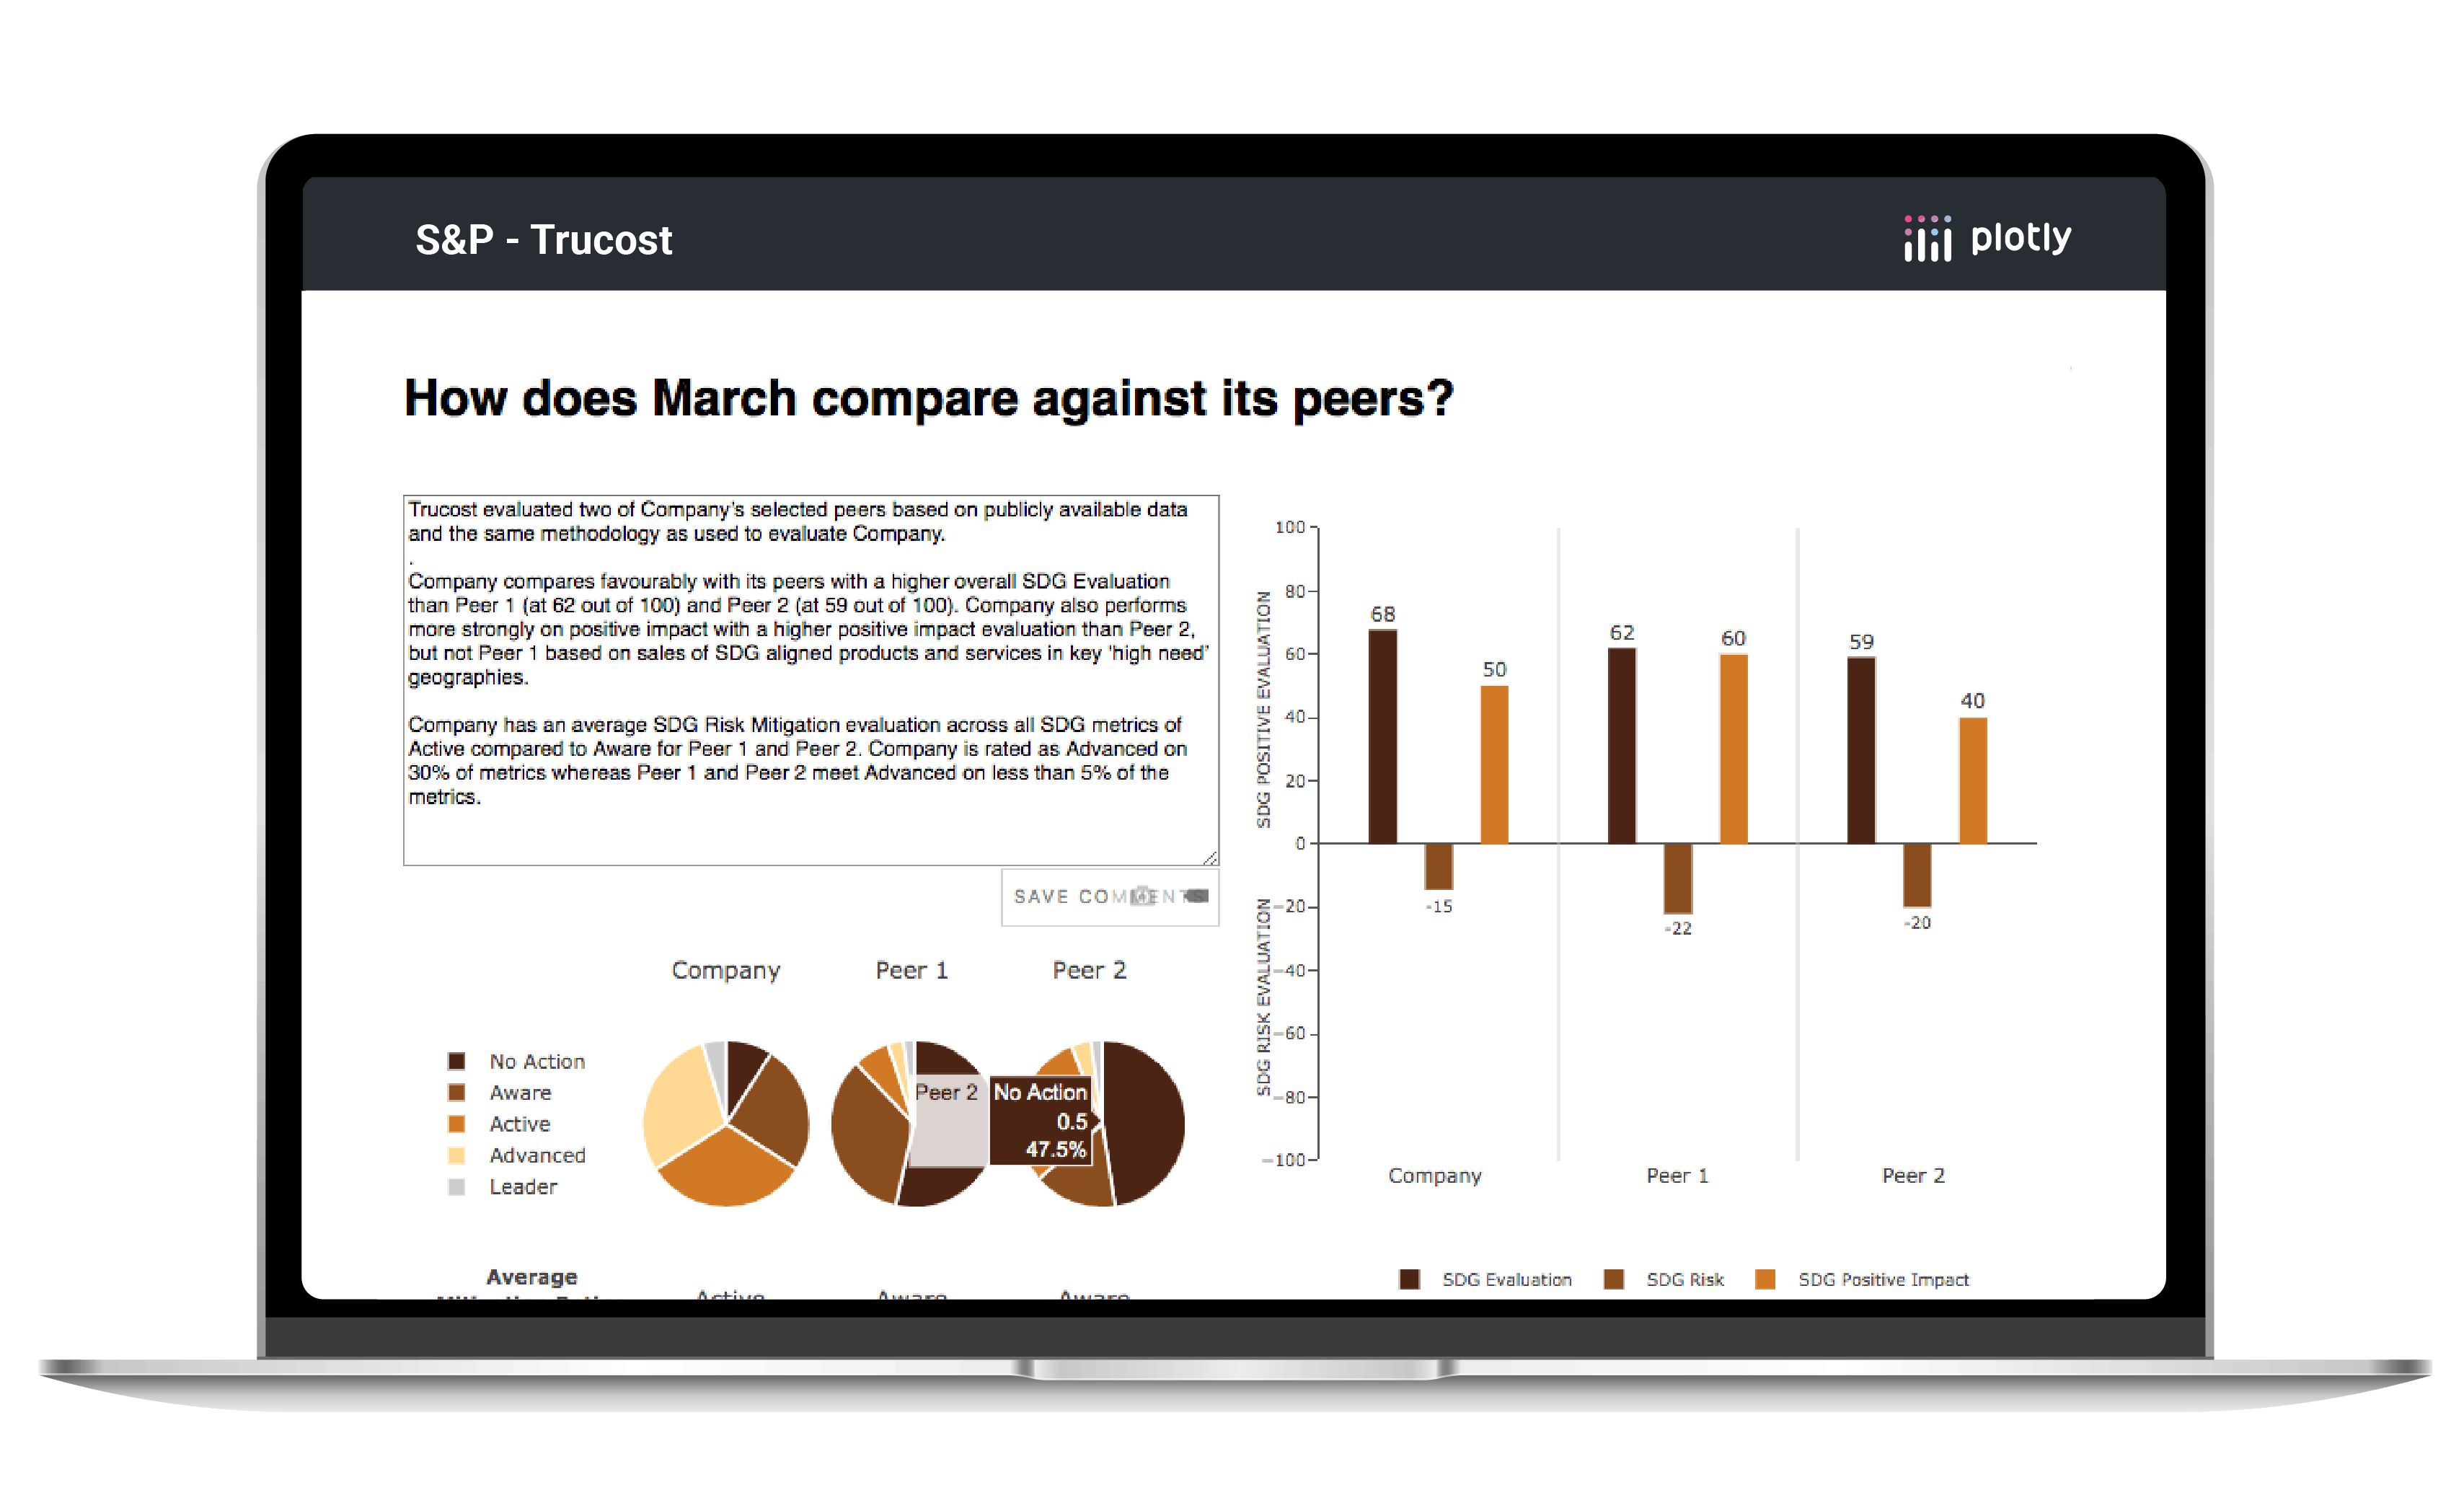
S&P - Trucost
- Plotly's Professional Services helped S&P transition to Python and build rich interactive reports through Dash Enterprise, streamlining their workflow.
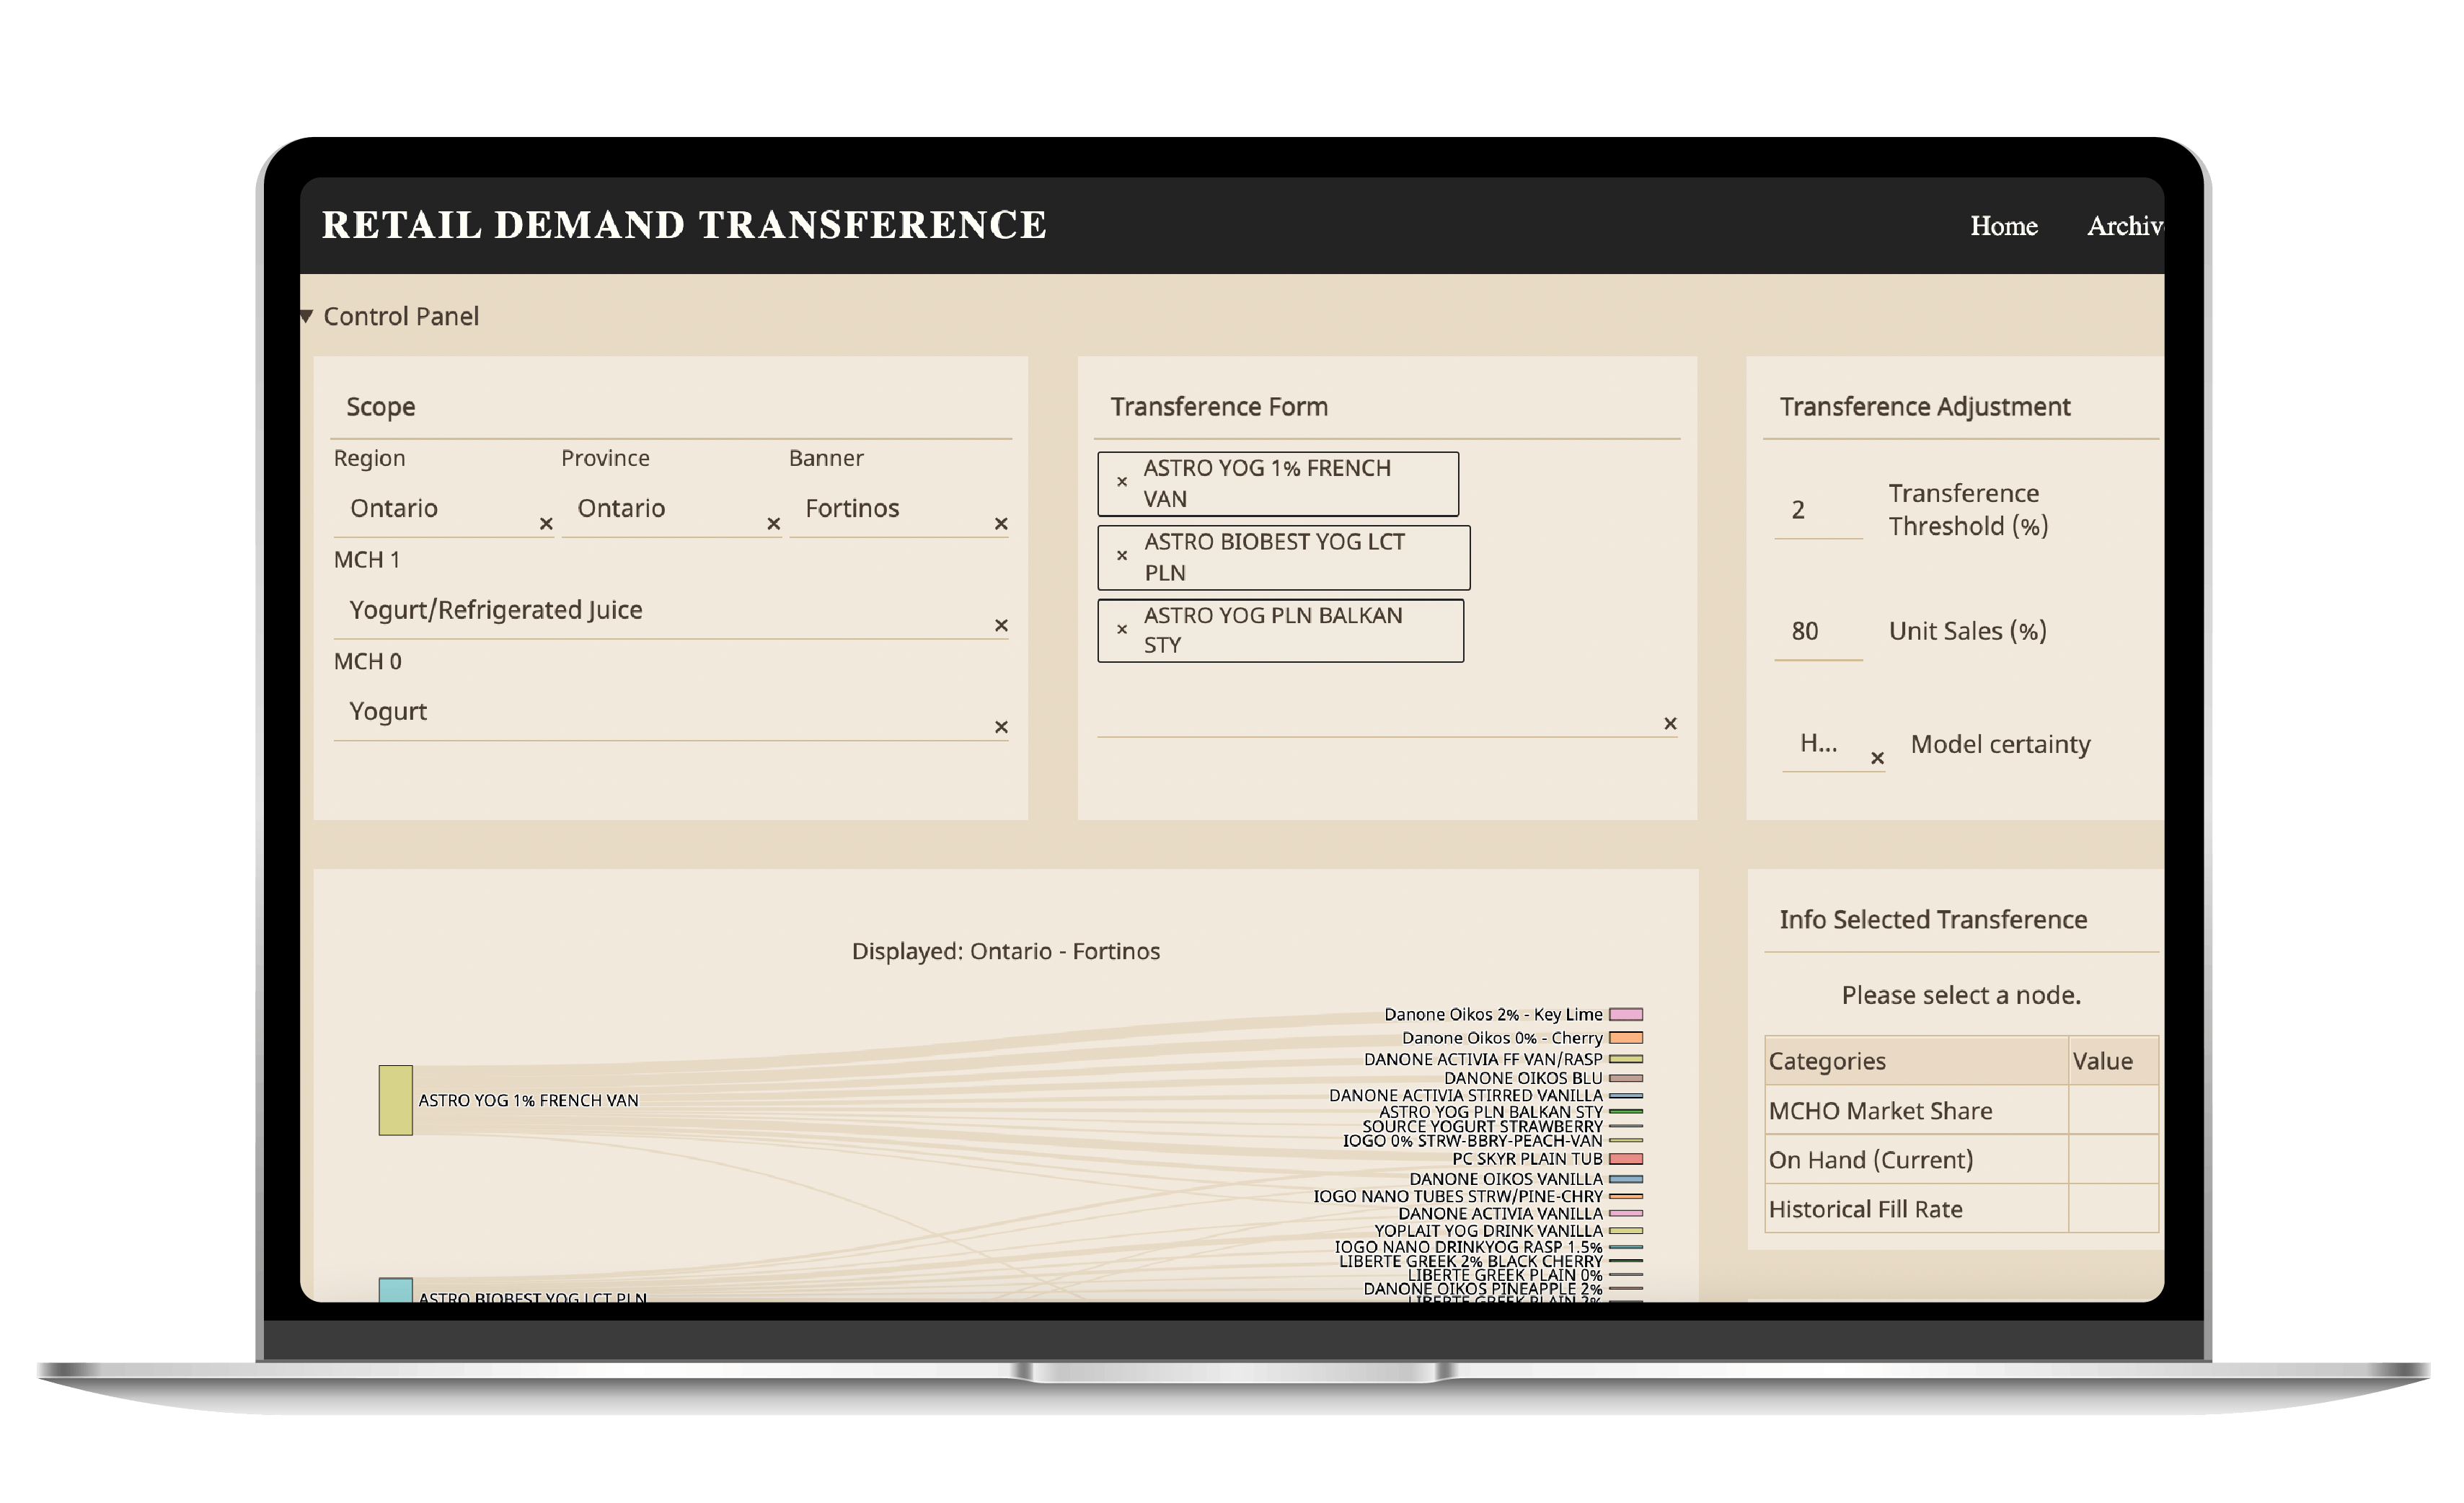
Major Canadian Retailer
- A major Canadian retailer wanted to elevate their inventory management system. They needed an automated way to analyze seasonality, location, and consumer buying behaviour. Plotly's Professional Services created a Dash app that utilizes Sankey data visualization to solve the demand transference problem and optimize their retail operations.
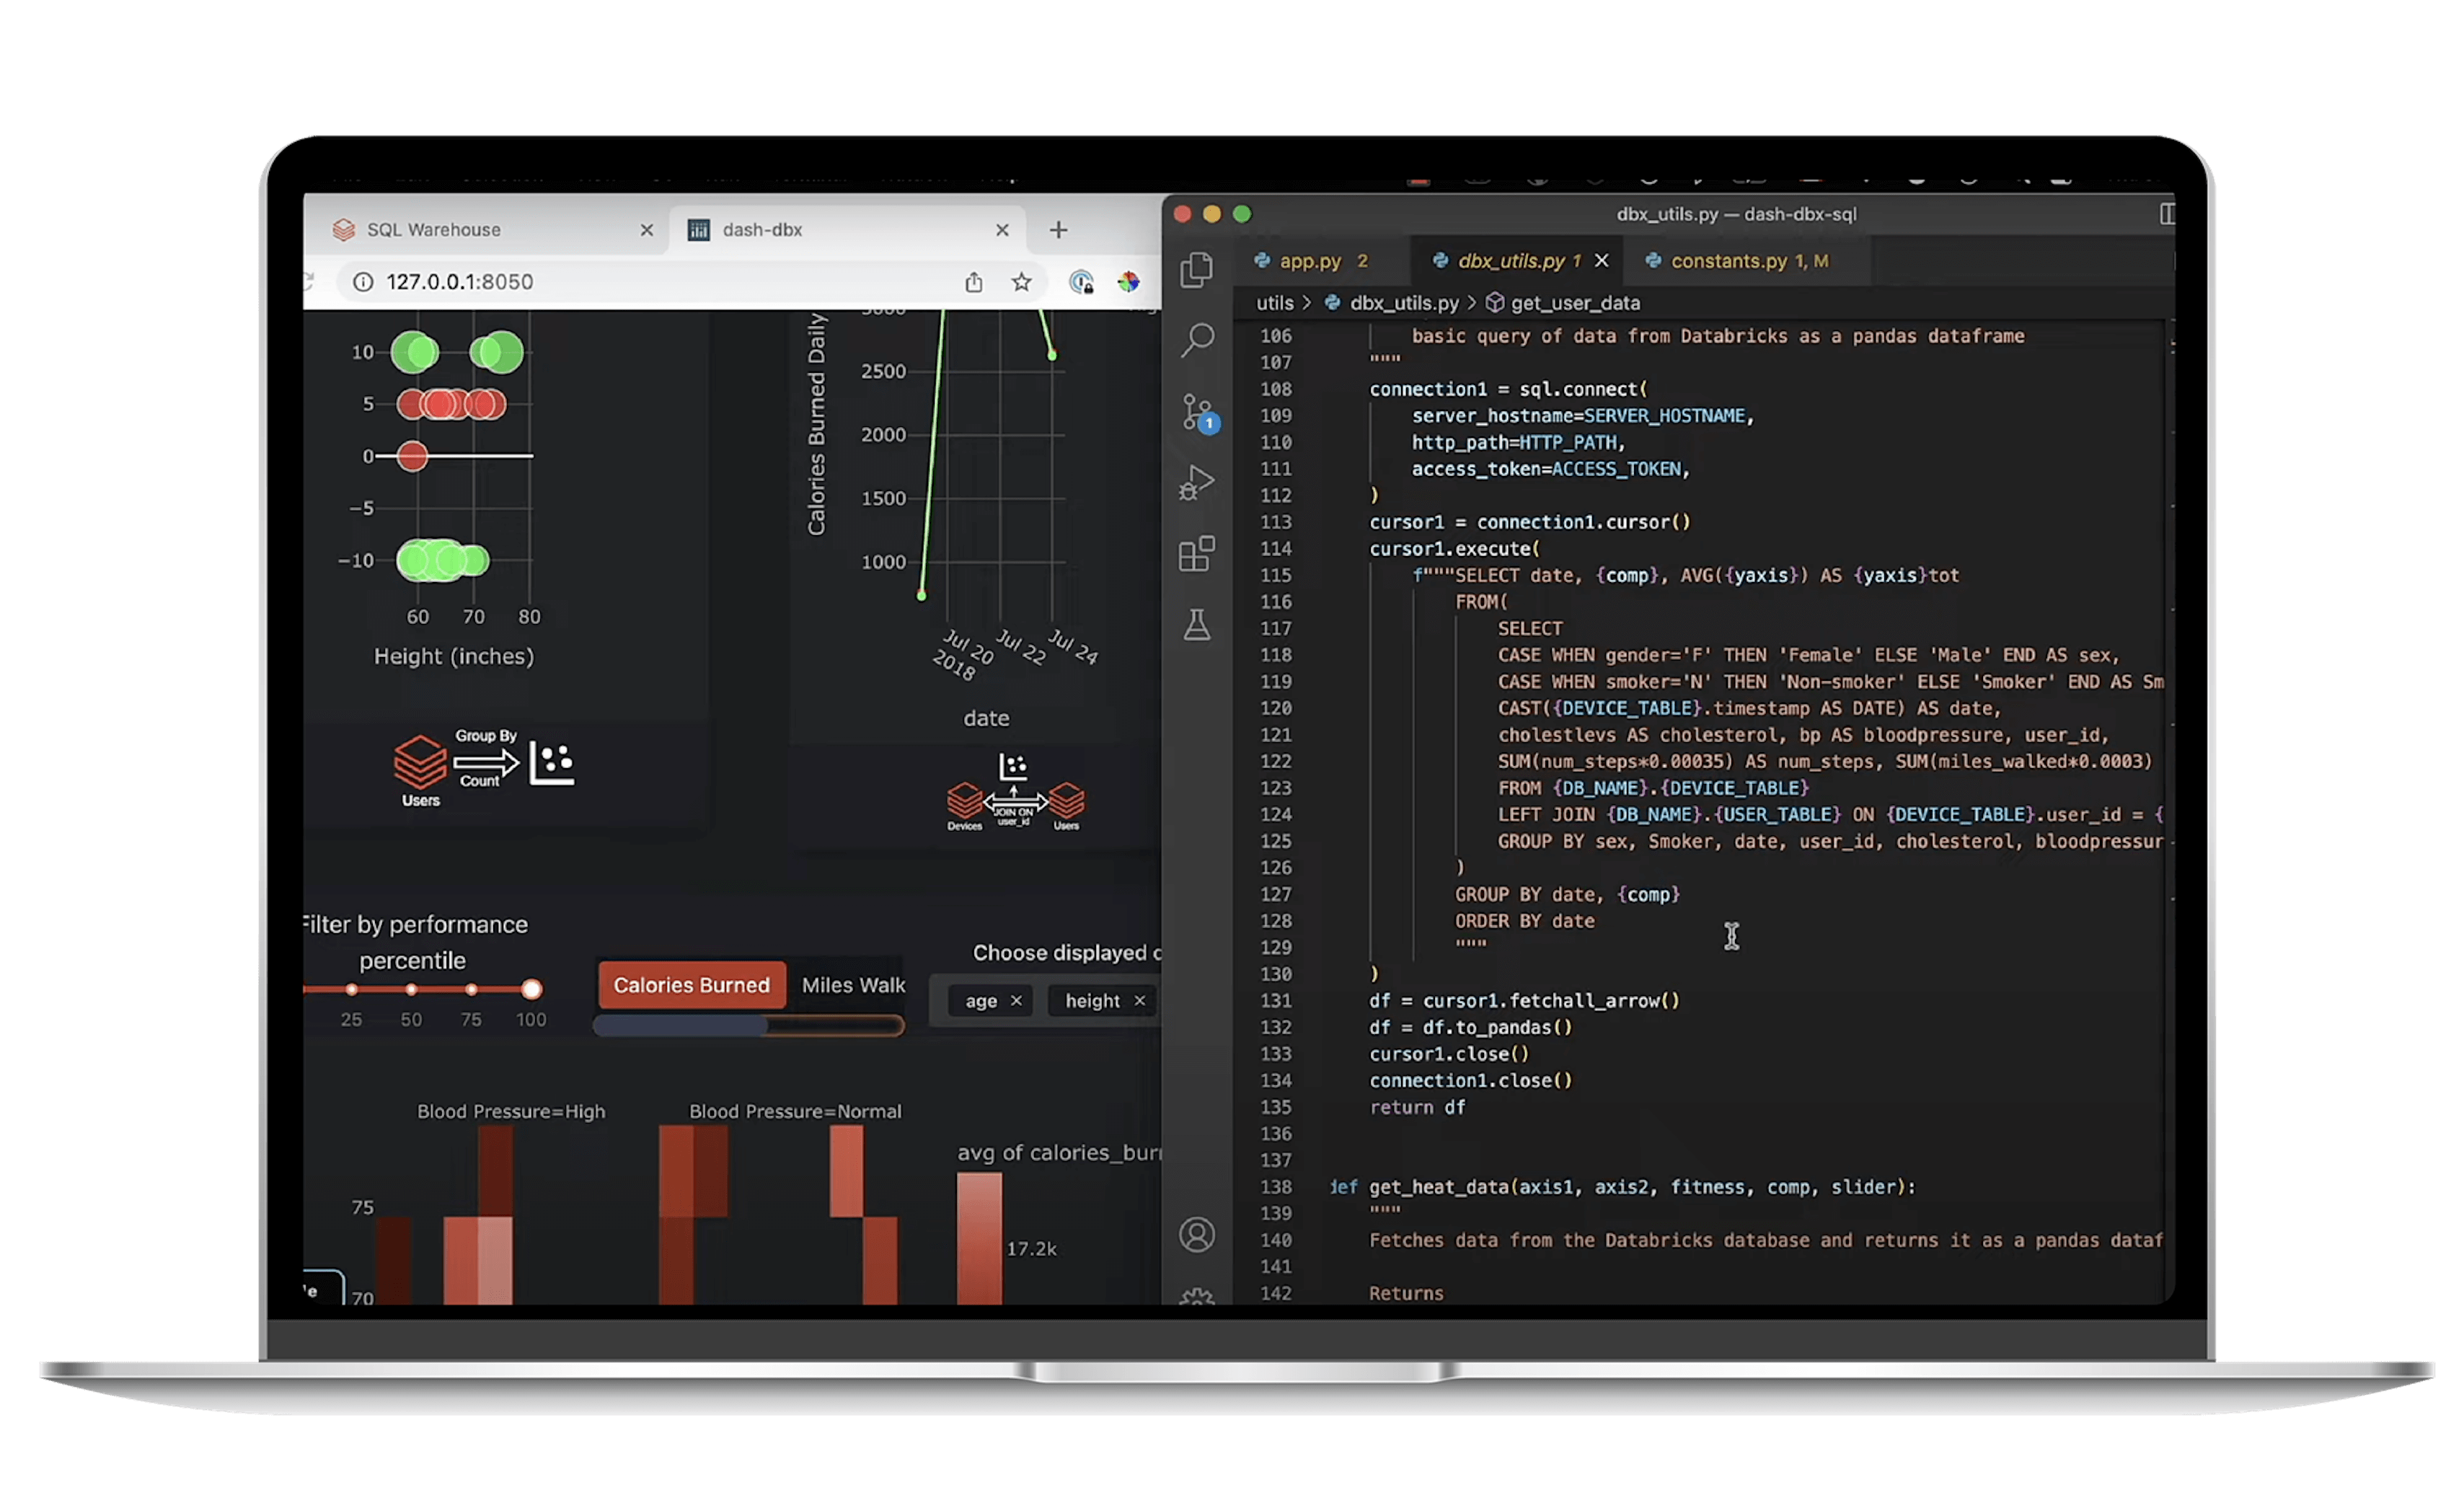
Databricks-Dash
- Plotly Professional Services produced a video demonstrating how to build Dash apps with Databricks via the databricks-sql python connector and what the advantages are for integrating them.
Dash Best Practices
- In this webinar, Plotly Professional Services provided best practices and answered commonly asked questions related to UI/UX, data connections, compute, and performance.