Plotly JavaScript Open Source Graphing Library
Built on top of d3.js and stack.gl, Plotly.js is a high-level, declarative charting library. plotly.js ships with over 40 chart types, including 3D charts, statistical graphs, and SVG maps.
plotly.js is free and open source and you can view the source, report issues or contribute on GitHub.
Deploy Plotly_js AI Dash apps on private Kubernetes clusters: Pricing | Demo | Overview | AI App Services
Read more about plotly.js features
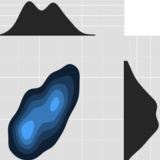
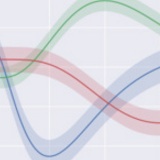
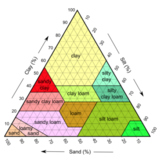
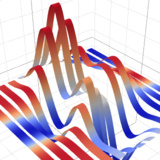
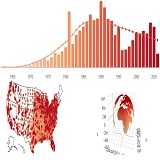
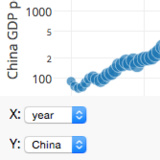
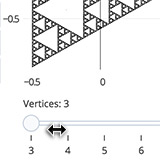
Sophisticated chart types
plotly.js abstracts the types of statistical and scientific charts that you would find in packages like matplotlib, ggplot2, or MATLAB.

d3.json('https://plotly.com/~DanielCarrera/13.json', function(figure){
var trace = {
x: figure.data[0].x, y: figure.data[0].y, z: figure.data[0].z,
type: 'contour', autocolorscale: false,
colorscale: [[0,"rgb( 0, 0, 0)"],[0.3,"rgb(230, 0, 0)"],[0.6,"rgb(255,210, 0)"],[1,"rgb(255,255,255)"]],
reversescale: true, zmax: 2.5, zmin: -2.5
};
var layout = {
title: 'turbulence simulation',
xaxis: {title: 'radial direction', showline: true, mirror: 'allticks', ticks: 'inside'},
yaxis: {title: 'vertical direction', showline: true, mirror: 'allticks', ticks: 'inside'},
margin: {l: 40, b: 40, t: 60},
annotations: [{
showarrow: false,
text: 'Credit: Daniel Carrera',
x: 0, y: 0, xref: 'paper', yref: 'paper'
}]
}
Plotly.newPlot(document.getElementById('contour-plot'), [trace], layout, {showLink: false});
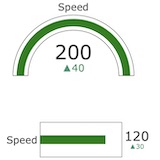
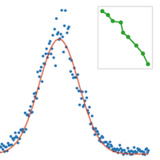
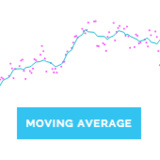
});Fully customizable
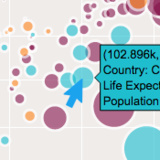
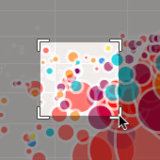
plotly.js charts are described declaratively as JSON objects. Every aspect of the charts, such as colors, grid lines, and the legend, has a corresponding set of JSON attributes.
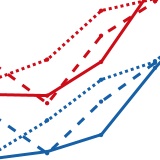
d3.csv('https://raw.githubusercontent.com/plotly/datasets/master/wind_speed_laurel_nebraska.csv', function(rows){
var trace = {
type: 'scatter', // set the chart type
mode: 'lines', // connect points with lines
x: rows.map(function(row){ // set the x-data
return row['Time'];
}),
y: rows.map(function(row){ // set the x-data
return row['10 Min Sampled Avg'];
}),
line: { // set the width of the line.
width: 1
},
error_y: {
array: rows.map(function(row){ // set the height of the error bars
return row['10 Min Std Dev'];
}),
thickness: 0.5, // set the thickness of the error bars
width: 0
}
};
var layout = {
yaxis: {title: "Wind Speed"}, // set the y axis title
xaxis: {
showgrid: false, // remove the x-axis grid lines
tickformat: "%B, %Y" // customize the date format to "month, day"
},
margin: { // update the left, bottom, right, top margin
l: 40, b: 10, r: 10, t: 20
}
};
Plotly.newPlot(document.getElementById('wind-speed'), [trace], layout, {showLink: false});
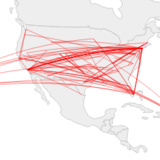
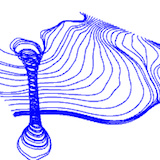
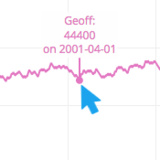
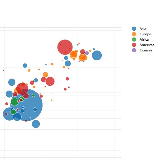
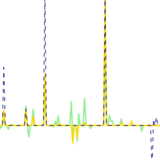
});High performance
Most plotly graphs are drawn with SVG. This offers great compatibility across browsers and publication-quality vector image export. Unfortunately, there are inherent performance limitations with the number of SVG elements that you can draw in the DOM.
plotly.js uses stack.gl for high performance 2D and 3D charting.
This chart was drawn with the
plotly.js chart type scattergl. scattergl charts render an order of magnitude faster than their SVG counterparts.
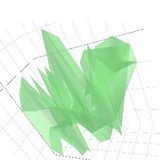
All 3D charts in
plotly.js are rendered with WebGL, leveraging the power of the GPU for fast interactivity.
view the interactive version
Universal